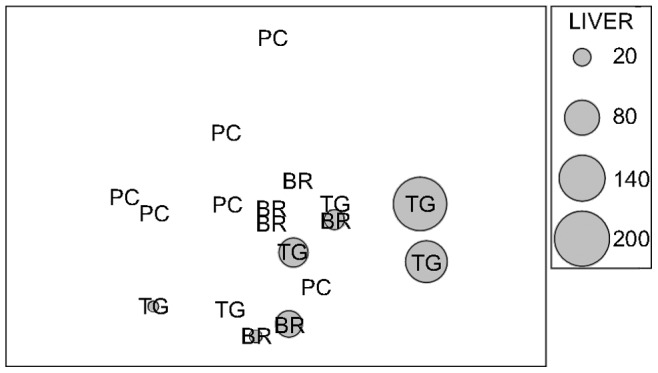
Figure 3. nMDS ordination of the Euclidean distance measure from normalized biomarker data.

A subset of 18 individuals ×15 biomarker responses was used. On each individual, grey circles of increasing size with increasing caulerpin concentration in liver were superimposed.
