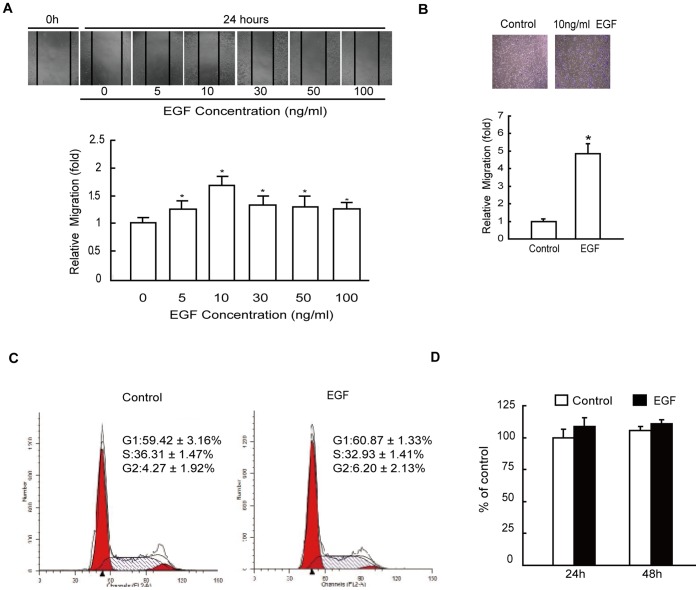
Figure 1. Effect of EGF on migration of HepG2 cells.
(A) Relative cell migration rate was determined using wound closure assay in HepG2 cells incubated in the absence or presence of 5, 10, 30, 50, and 100 ng/mL EGF for 24 h. (B) The cell migration was assessed by the Transwell migration assay in HepG2 cells incubated in the absence (control) or presence of 10 ng/mL EGF for 8 h. (C) HepG2 cells were cultured in the absence (control) or presence of 10 ng/mL EGF for 24 h and cell cycle was analyzed by flow cytometry. (D) HepG2 cells were cultured in the absence (control) or presence of 10 ng/mL EGF for 24 or 48 h and cell proliferation was analyzed by MTT assays. Each value represents the mean ± SD of 5 independent determinations. *: P<0.05, referring to the difference between cells treated with and without EGF.

