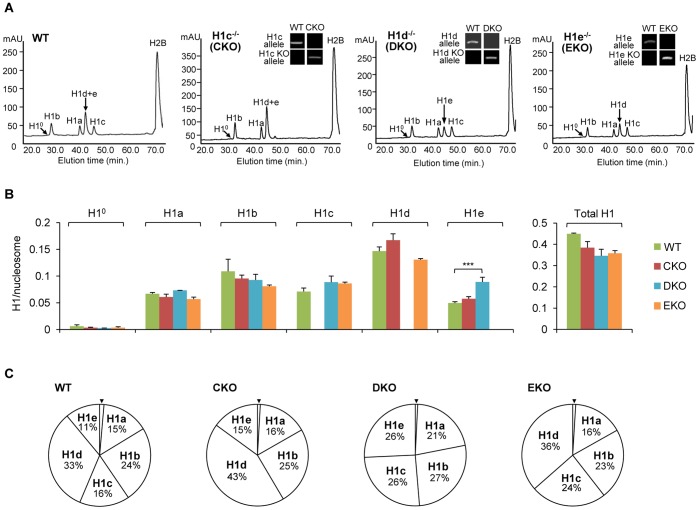
Figure 3. Generation and reverse-phase HPLC analysis of single-H1 KO ESCs.
(A) RP-HPLC analysis of total histones from WT and the single-H1 KO ESCs. The identity of the histone subtypes is indicated above each peak. mAU, milli-absorbency at 214 nm. Genotype analyses of single-H1 KO ESCs are shown in insets in respective HPLC profiles. (B) The ratios of individual H1 (left) and total H1 (right) to nucleosome for WT and single-H1 KO ESCs. Ratios were determined from the RP-HPLC and mass spectrometry analyses as described in methods. ***: P<0.001 (C) The percentage of each H1 subtype among total H1 histones for WT and single-H1 KO ESCs. % total H1 for H10 (marked with arrowhead) is equal to or less than 1%.

