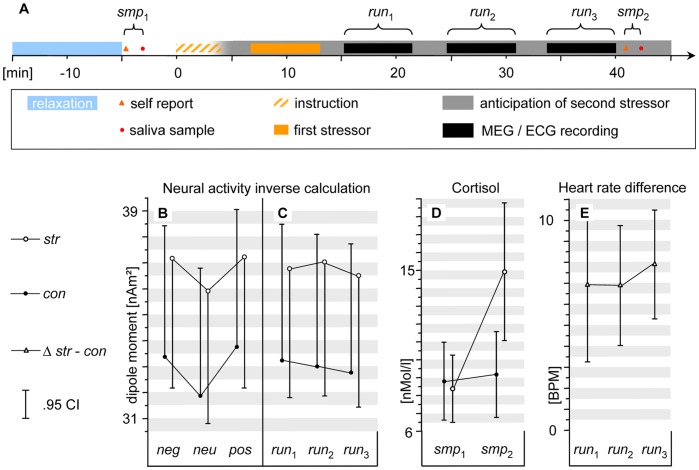
Figure 1. Experimental design and principal findings.
Panel A: Timeline of experimental procedures. The onset of the first stressor is defined as the advent of the examination jury giving instructions (dashed orange bar). The solid orange bar refers to the actual self disclosing speech and video feedback. The unsettling situation was not terminated until after the last recording run and sampling were completed in that the subjects anticipated a second stressor. This was announced at the end of the instruction (gray bar). Panels B to E: The closed circles are data points under the stress induction str, and the open circles are data points under the control procedure con, the open prisms are the differences between both procedures. The vertical bars indicate the.95 confidence limits. Panel B: Bar triplets show activity evoked by aversive (neg), neutral (neu) and positive images (pos) averaged over the subsequent recording runs. Evoked activity refers to the average amplitude of the estimated source strength (mean dipole moments [nAm2] derived from the standard ROI and time frame; see Results and Figure 2). Panel C: The same depiction for the three consecutive runs, irrespective of the picture content. Note the stable temporal persistence of the stress main effect. Panel D: Salivary cortisol concentration, sampled prior to (smp 1) and after the stress induction and MEG recordings (smp 2). Panel E: Ipsative data of individual heart rate in corresponding runs (str minus con). Note, again, the stable stress level over the three subsequent recording runs.

