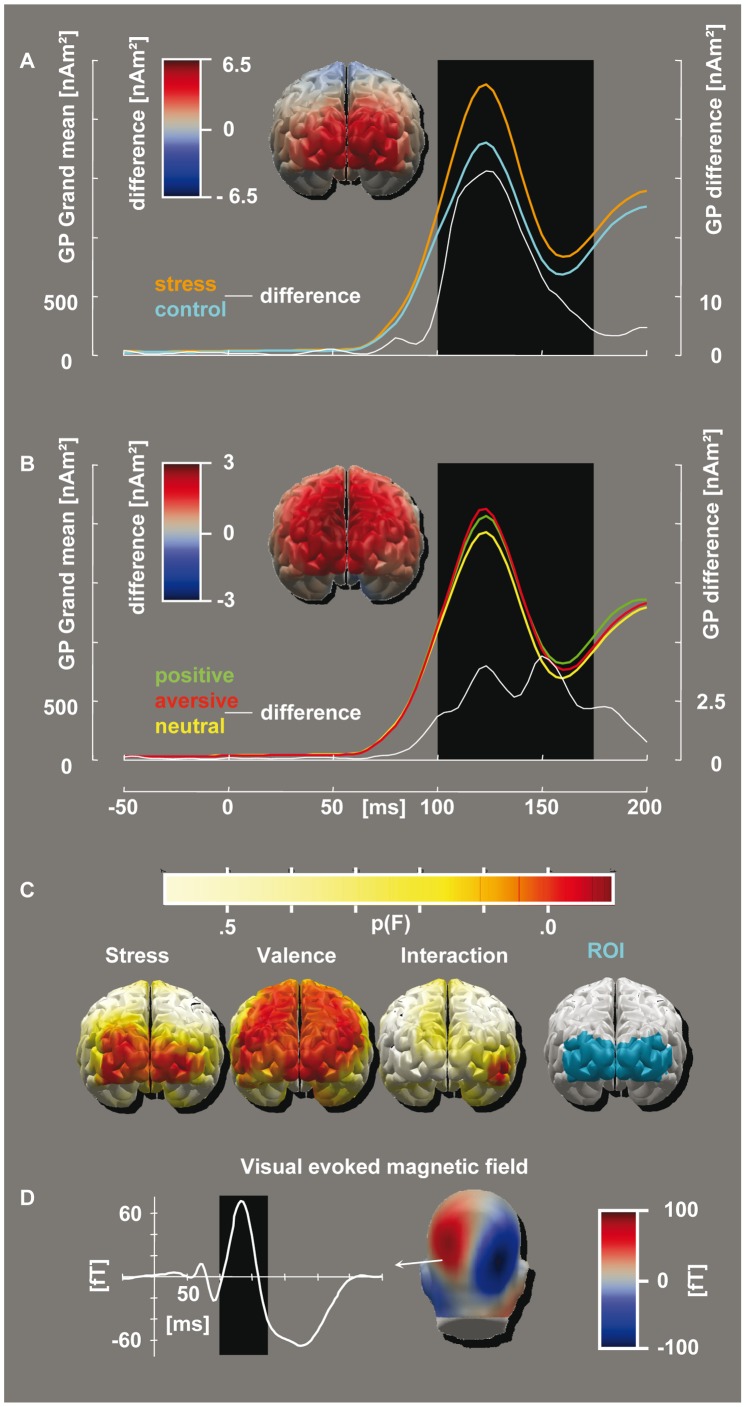
Figure 2. Conditional differences in evoked activity.
The morphologies refer to a dipole cluster of interest as depicted in the rightmost image in panel C, whereas the topographies (all from an occipital perspective) pertain to an interval of [100∶175] ms (indicated by the black boxes in Panels A, B and D). The evaluations reported in the Results section are based on this selection of time span and ROI. Panel A: The global power of the estimated dipole moments for the stress induction versus the control procedure (scaling as in the left-hand ordinate) and the corresponding difference (right-hand ordinate, white graph). The topographic depiction also refers to this difference. Panel B: The activity evoked by emotional arousing (positive or aversive) and neutral pictures, as well as the difference between arousing and neutral scenes (topographic depiction and white graph). Panel C: Parametric map of the dipole-wise ANOVA (uncorrected). Left to right: The main effect of stress induction, the main effect of emotional valence category viewed and the interaction between both factors. Shown at the far right is the ROI that was utilized for the area measures. Panel D: The evoked field strength of a selected left occipital SQUID. This depiction allows a comparison between the deflections in Panels A and B with standard visual-evoked fields. The interval of interest, marked as a black box, corresponds to the visual N1m.

