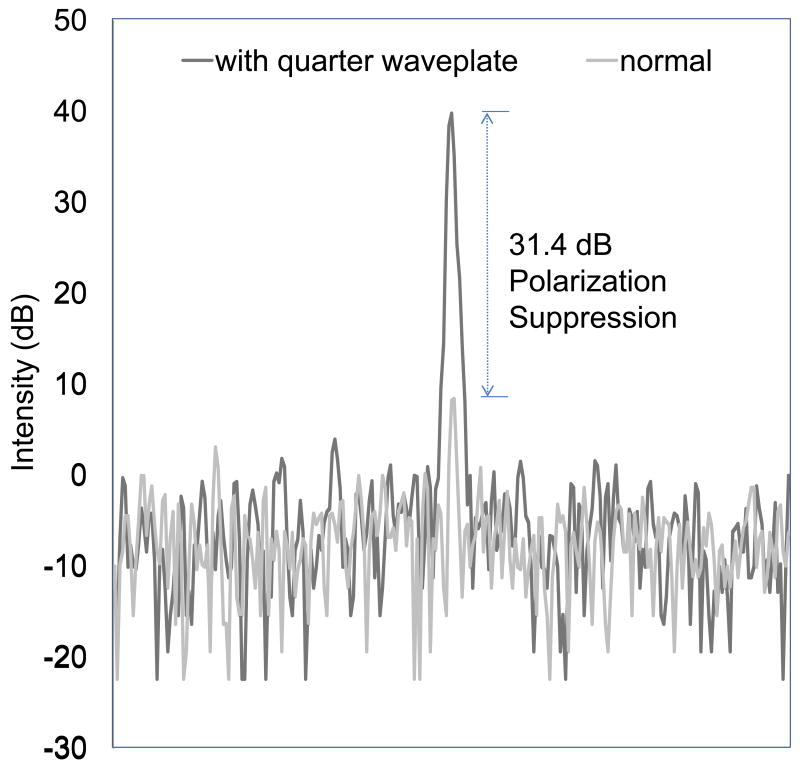
Figure 3.
Line profiles of a mirror surface. The x-axis is a function of depth and the y-axis shows the logarithmic intensity (dB) when the OCT probe was configured 1) normal-gray line or 2) with a quarter wave plate-black line. The two separate measurements are graphed together to illustrate the degree of polarization suppression, which is the difference between the two signals.

