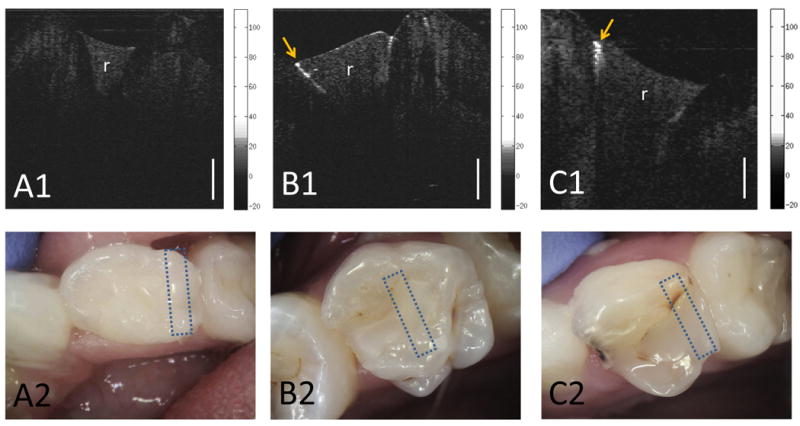
Figure 4.

A1) CP-OCT image and A2) intraoral photo of a resin composite filling (r) that was recently placed. B1) CP-OCT image and B2) intraoral photo of a resin composite filling (r) that has been in the mouth for well over 6 months and was clinically sound. The CP-OCT image shows high scattering of the underlying enamel below the restoration-tooth interface indicating an early failure of the restoration due to demineralization. C1) Positive control: CP-OCT image and C2) intraoral photo of a resin composite with cavitated secondary caries. The backscattered logarithmic intensity (dB) scales of the CP-OCT images are shown. The CP-OCT lateral scan distance was 5.2 mm. White scale bar is 1 mm of optical depth. Box areas shown on intraoral photos represent the area that was scanned with CP-OCT.
