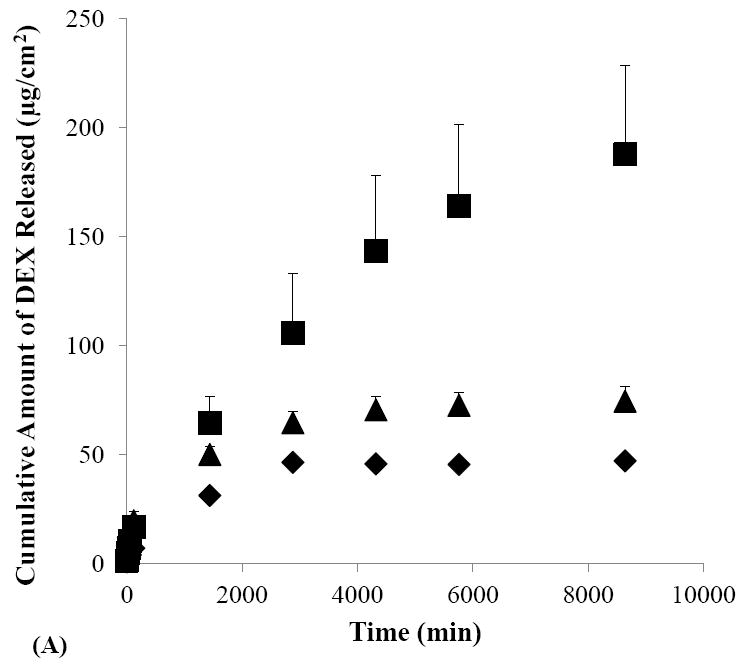
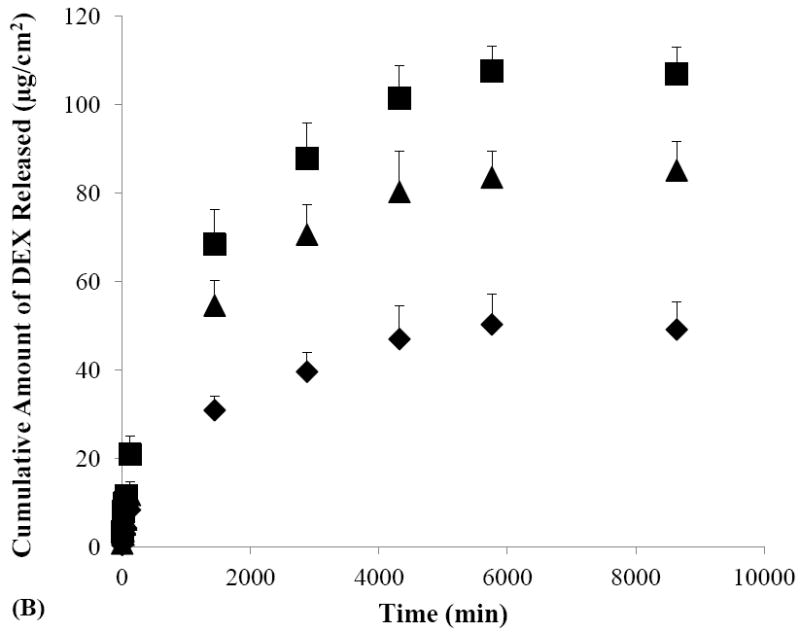
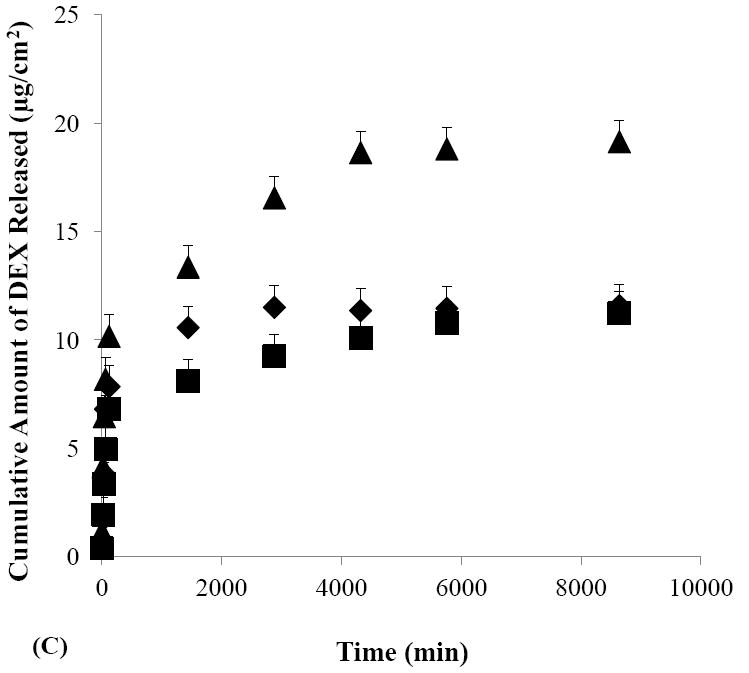
Figure 4.


Cumulative amounts of DEX released from human sclera versus time in the release studies performed after the passive (closed diamonds), cathodal iontophoresis (closed squares), and anodal iontophoresis (closed triangles) transport experiments of (A) SMM, (B) SSM, and (C) control. Data represent the mean and standard deviation, n ≥ 3.
