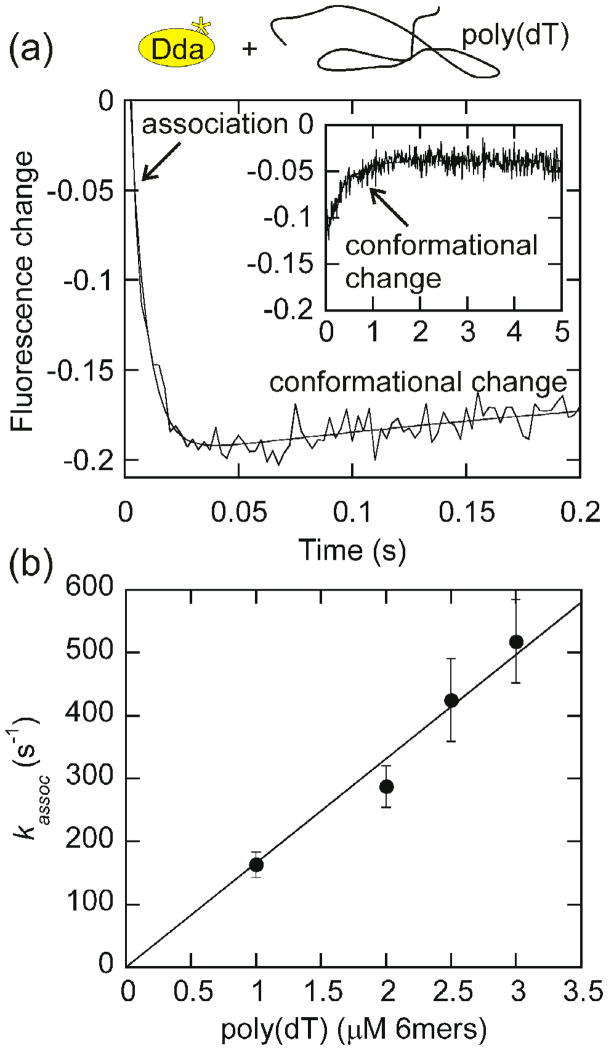
Fig. 1. Measurement of the rate of Dda association with DNA.
(a) The fluorescence change for 200 nM Dda association with 6 μM poly(dT), in nucleotides, is plotted. Data was fit to a double exponential. The observed rate of association (first phase) is 163 ± 20 s−1 at 6 μM poly(dT), in nucleotides (1 μM poly(dT), in binding sites). The second phase (shown in inset) remains constant as the poly(dT) concentration increases (Table S1) and likely represents a slow conformational change. (b) The rate of association (first phase) increases linearly with increasing poly(dT) concentration. Data was plotted with the poly(dT) concentration in 6mers since Dda is known to have a 6 nt binding site size15 and was fit to a line using Kaleidagraph software. The slope of the line, 1.66×10⁸ M−1s−1, represents the association rate constant.

