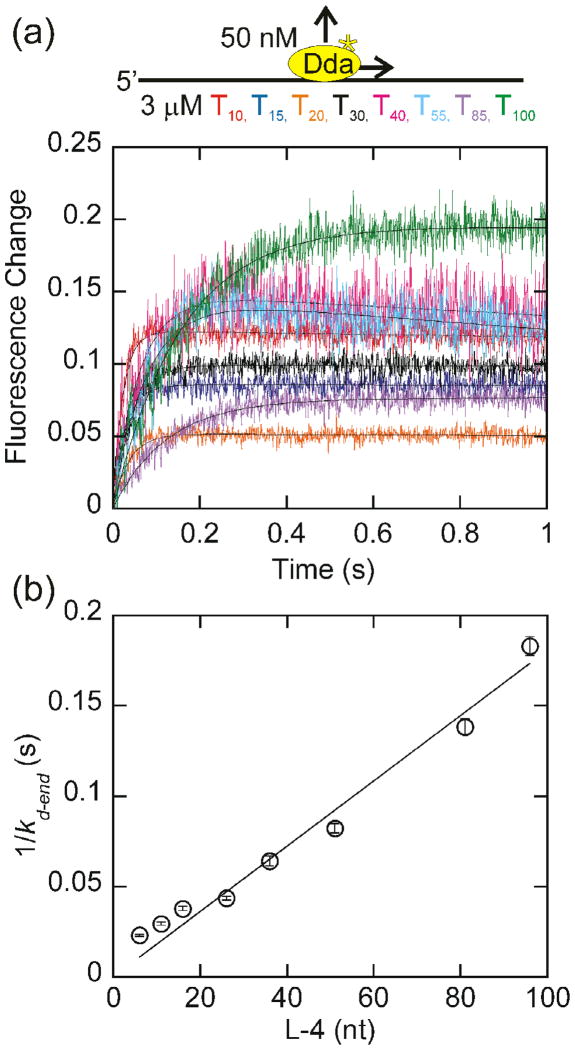
Fig. 5.
Change in tryptophan fluorescence as a function of oligonucleotide length with homopolymeric oligonucleotides under conditions where the substrate concentration is in vast excess. (a)The change in fluorescence of 50 nM Dda as it dissociates from 3 μM (in nucleotides) dT10, dT15, dT20, dT30, dT40, dT55, dT85, and dT100 is plotted. The observed dissociation rate constants, obtained by fitting to a single exponential were 44.1 ± 1.0 s−1, 34.7 ± 1.0 s−1, 27.2 ± 0.8 s−1, 23.8 ± 0.5 s−1, 16.4 ± 0.7 s−1, 13.0 ± 0.4 s−1, 8.1 ± 0.2 s−1, 6.3 ± 0.2 s−1 for dissociation from dT10, dT15, dT20, dT30, dT40, dT55, dT85, and dT100, respectively. (b) The inverse of the rate constant for dissociation from the end of the oligonucleotide, kd-end, which is equal to the observed dissociation rate constant minus the intrinsic dissociation rate constant (Fig. 2b) is plotted versus the length of the substrate, adjusted for binding site size. Only oligonucleotides of at least 30 nucleotides in length are included in the fit. One-half the inverse slope of the resulting line provides a translocation rate of 287 ± 13 nucleotides/s. The fit was constrained through the origin to constrain kd-in to the value measured in Fig. 2b.

