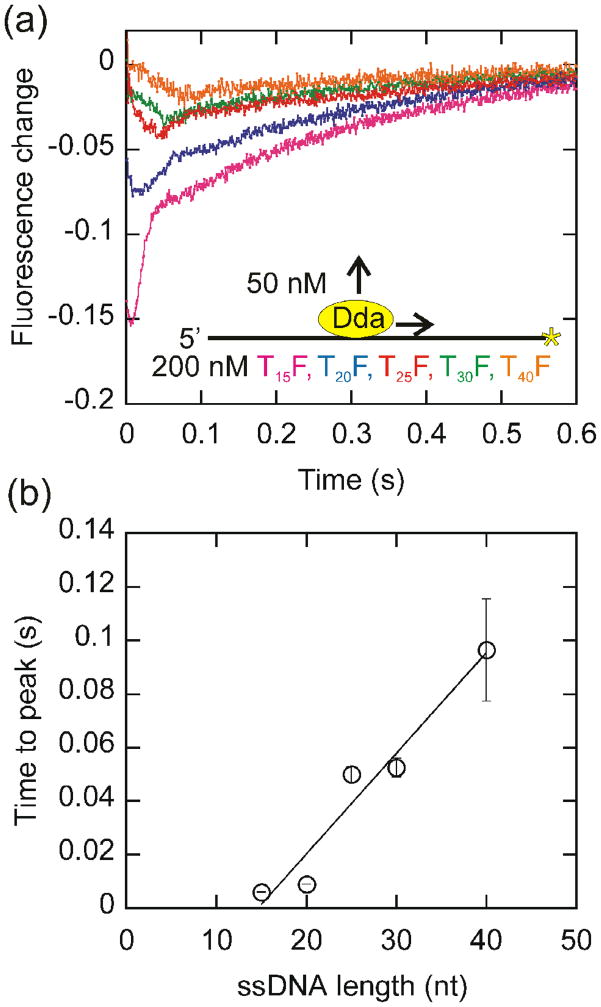
Fig. 6.
Translocation of Dda along fluorescein labeled oligonucleotides of various lengths. (a) The change in the fluorescence of 3′-fluorescein labeled oligonucleotides of varying length was monitored after a 515 nm cutoff filter in the presence of ATP. The initial decrease in fluorescence was determined to correspond to the translocation of Dda. (b) The time to the maximal fluorescence change is plotted versus the length of the oligonucleotide. The translocation rate was determined to be 266 ± 37 nucleotides/s by the inverse slope of a linear fit.

