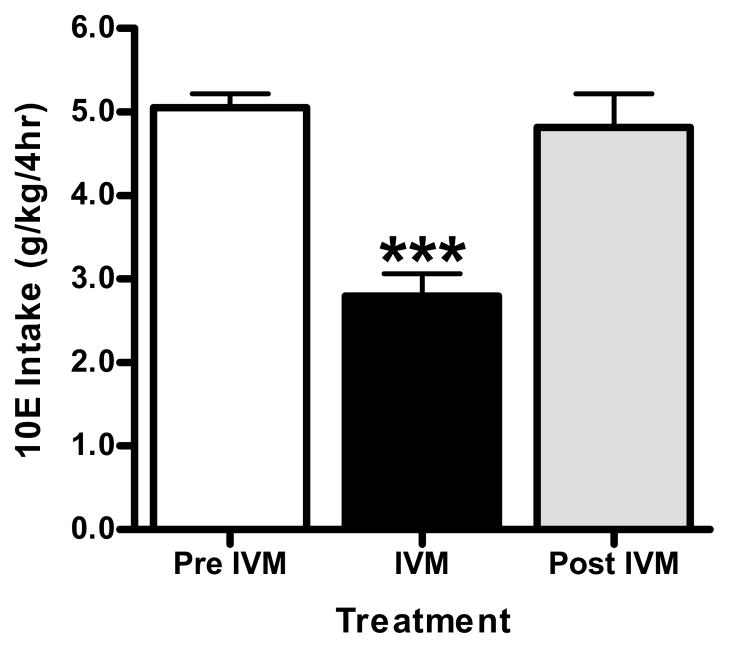
Figure 8.
10 mg/kg IVM administration reduced ethanol (10% v/v) intake in female C57BL/6 mice using an intermittent, limited (4-h) access paradigm. After attaining stable drinking levels, IVM was administered. Bars represent levels from the day prior to IVM injection (white; Pre IVM), the day of the IVM injection (black; IVM) and the day after the IVM injection (gray; Post IVM). Values represent the mean ± SEM for 8 mice. ***P<0.001 versus Pre IVM, Tukey multiple comparison post-hoc test.

