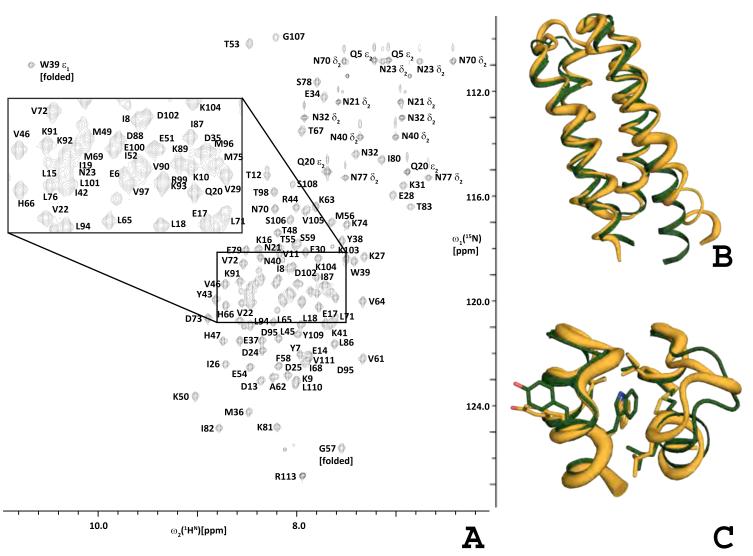
Figure 7.
2D [15N,1H] HSQC and NMR solution structure of DRNN.
2D [15N,1H] HSQC spectrum (~1 mM protein concentration, 20 mM sodium phosphate, pH 6.5) recorded at 750 MHz 1H resonance frequency. Resonance assignments are indicated using the one-letter code for amino acids (A). Global comparison of the DRNN model (green) and the DRNN solution structure (orange) (B). The region around W39 of the DRNN model and the solution structure (C) (corresponds to layer B in figures 5 and 6) See also Supplemental Figure 7.

