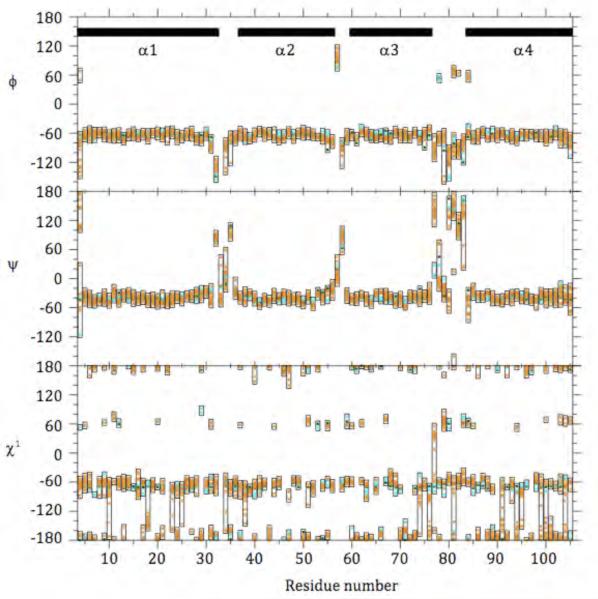
Figure 8.
Comparison of DRNN NMR Structural Ensemble, DRNN X-ray Crystal Structure, and DRNN design model in φ, ψ, and χ1 space. The values of the ensemble of conformers representing the NMR solution structure are shown in orange with boxes drawn around the observed range. The values observed for the two chains of the X-ray structure are shown in blue, and the values for the design model are shown in green. The black bars at the top indicate the location of the α-helices. See also Supplemental Figure 6.

