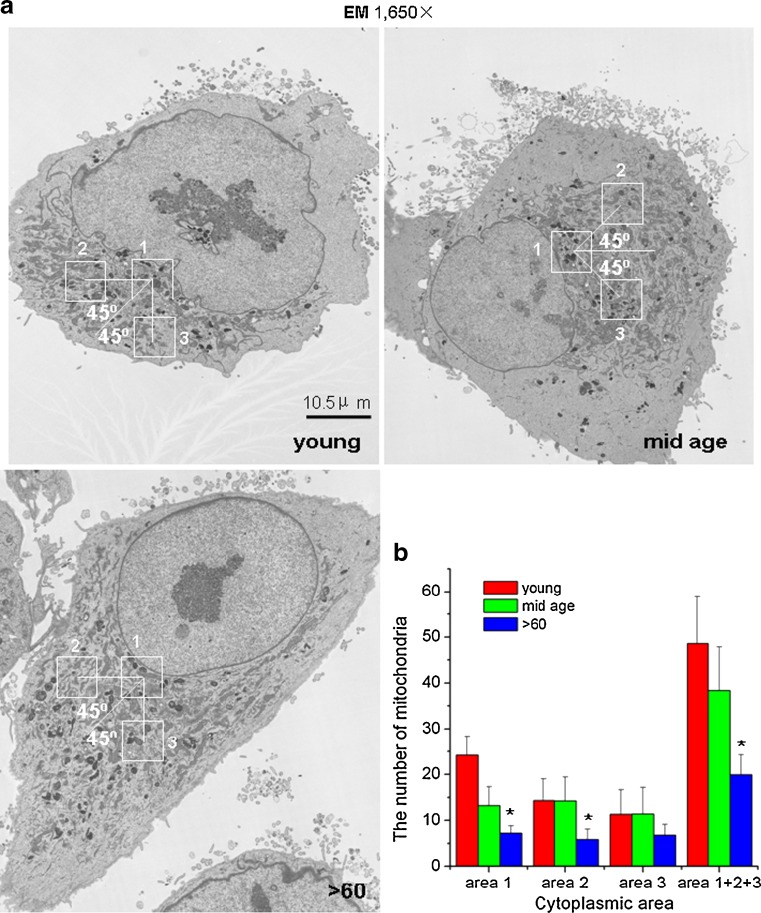
Fig. 7.
a The mitochondria in young and mid-age samples are in discrete perinuclear regions of the cells and appear more tightly packed compared to those in the >60-year-old samples. Scale bar 10.5 μm. b The histogram confirms visual observation of decreased numbers of individual mitochondria with increased aging. The data represent the mean of the average counts in all three areas of 20 cells per sample within the group

