Figure 1.

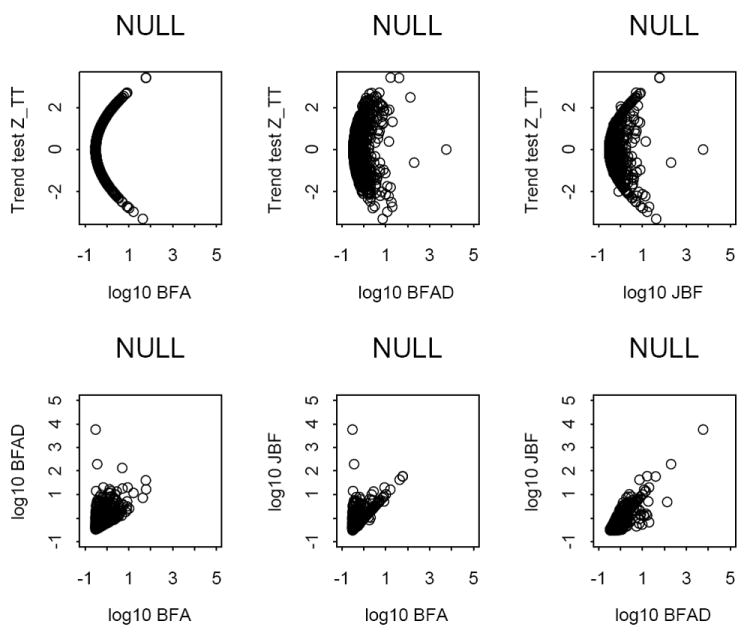
Under H0: plots of the trend test vs. log10 BFA, log10 BFAD and log10 JBF (row 1), and plots among log10 BFA, log10 BFAD and log10 JBF (row 2). The number of replicates is 1,000.

Under H0: plots of the trend test vs. log10 BFA, log10 BFAD and log10 JBF (row 1), and plots among log10 BFA, log10 BFAD and log10 JBF (row 2). The number of replicates is 1,000.