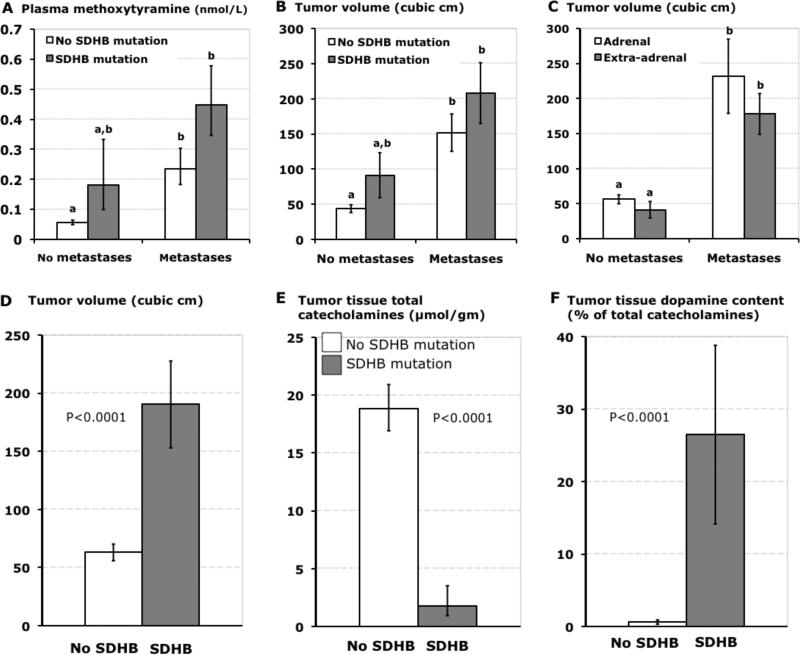
Figure 4.
Bar graphs (means±SE) illustrating distinguishing characteristics of tumors due to SDHB mutations. Plasma concentrations of methoxytyramine and volumes of PPGLs in patients with and without SDHB mutations are shown sub-grouped according to presence of absence of metastases in panels A and B, whereas volumes of primary tumors according to adrenal and extra-adrenal locations are shown sub-grouped according to presence of absence of metastases in panel C. Tumor volumes, tissue concentrations of total catecholamines and percent contents of dopamine in patients with and without SDHB mutations are shown respectively in panels D, E and F. Data are restricted to patients with established mutations or in whom SDHB mutations were excluded by gene testing. Tumor volumes represent those for primary tumors. Data for tumor tissue catecholamines are from primary tumors resected from 11 patients with SDHB mutations (7 with distant metastases) and 145 without SDHB mutations. a,bDifferent alphabetic characters in upper panels indicate significant differences (P<0.05) between groups, whereas presence of identical characters indicates lack of a significant difference.

