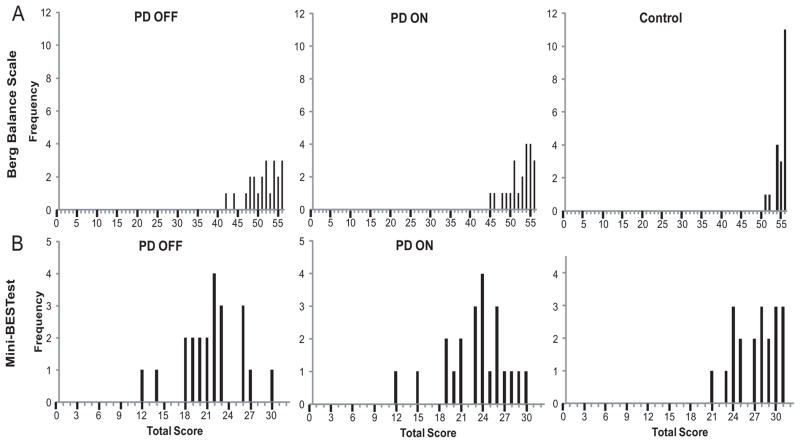
Figure 2.
Frequency distribution of scores for the BBS (A) and mini-BESTest (B) are shown for PD OFF, PD ON, and Controls. Scores on the BBS tended to cluster at the upper end of the range for all groups, compared to the more normal distribution in mini-BESTest scores, suggesting the possibility of ceiling effects with the BBS.

