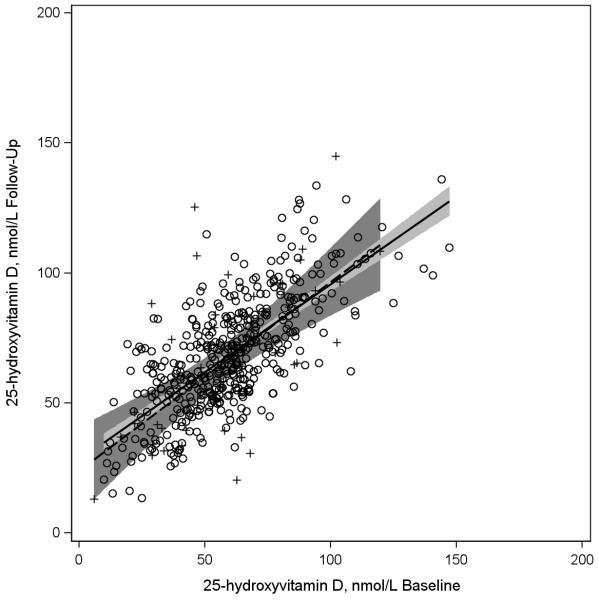
Figure 2.
Scatterplot of plasma 25-hydroxvitamin D (25(OH)D) concentrations assessed at follow-up (2002-2005) versus baseline (1997-2000) among participants in the Osteoporosis and Periodontal Disease (OsteoPerio) Study (n=672) with least squares regression linesa representing participants with bloods drawn in the same (n=444) seasonb and at opposite times of yearb (n=49) at baseline and follow-up.
a Solid regression line and circles (O) represents women with bloods drawn at baseline and follow-up in the same season. Dashed regression line and plus signs (+) represents women with bloods drawn at opposite times of year at baseline and follow-up.
b Seasons are defined by the following four seasons: winter (January-March), spring (April-June), summer (July-September), and fall (October-December). There were 444 women with bloods drawn at baseline and follow-up in the same season and 49 women with bloods drawn at baseline and follow-up at opposite times of year (January-March compared to July-September or April-June compared to October-December).

