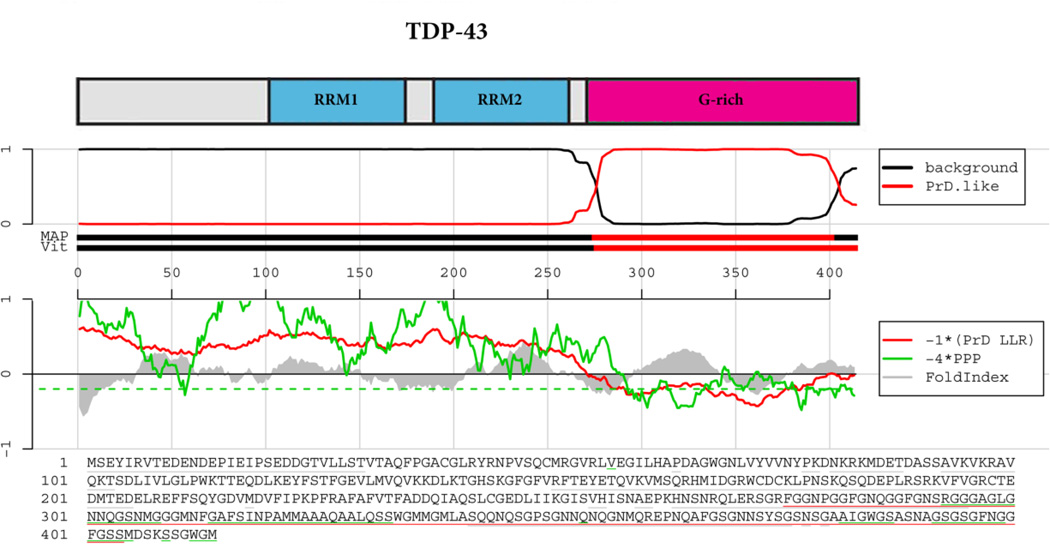
Figure 2. TDP-43 prion domain prediction.
The top panel shows the domain architecture of TDP-43. RRM=RNA-recognition motif; G-rich=Glycine-rich domain. Below the cartoon the probability of each residue belonging to the hidden Markov model state prion domain or ‘background’ is plotted; the tracks ‘MAP’ and ‘Vit’ illustrate the Maximum a Posteriori and the Viterbi parses of the protein into the prion domain or non-prion domain (Alberti et al., 2009). The plots in the middle panel show the log-likelihood ratio scores (PrD LLR) from the Alberti et al. algorithm in red (Alberti et al., 2009), the predicted prion propensity (PPP) log-odds ratio scores from the Toombs et al. algorithm in green (Toombs et al., 2010) and FoldIndex scores in grey (Prilusky et al., 2005), each averaged over sliding windows of 41 residues. Note that the curves are rescaled to give similar ranges, and so that negative scores are suggestive of both disorder and prion propensity; the rescaled cutoff corresponding to PPP > 0.05 is indicated by the dashed green line. The lower part of the panel shows the primary sequence of TDP-43. The Alberti prion domain is underlined in red (Alberti et al., 2009), the Toombs prion domain in underlined in green (Toombs et al., 2010), and the cyan residues represent the regions that satisfy these requirements of disorder and prion propensity of the Toombs algorithm (Toombs et al., 2010) as well as the amino acid composition requirement of the Alberti algorithm (Alberti et al., 2009). Note the lack of cyan residues for TDP-43.

