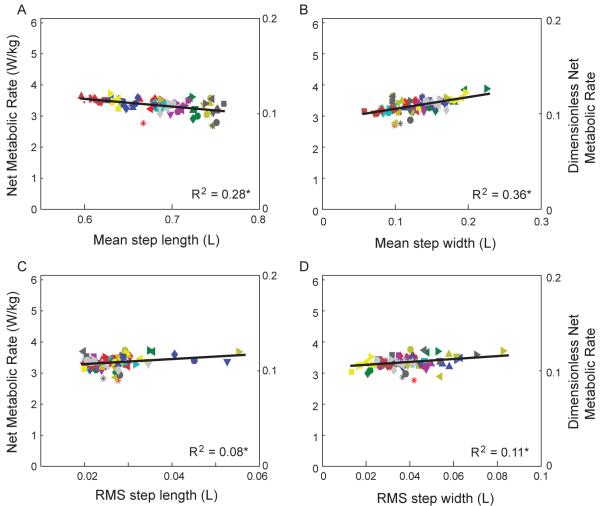
Figure. 4.
Energetic cost of walking as a function of step parameters, across all conditions. Net metabolic rate is plotted against (A) mean step length, (B) mean step width, (C) RMS step width variability, and (D) RMS step length variability, for all perturbation trials. Each symbol denotes a different condition, and each color denotes a different subject (N = 11). Plot shows linear regression fit; separate offsets for each subject are averaged together. Although each parameter could partially explain changes in metabolic rate (asterisk * denotes P < 0.05), linear dependence between step parameters (see Fig. 3) suggests that perturbations largely caused changes in a single linear combination of step parameters, which induced a single effect on energy expenditure.

