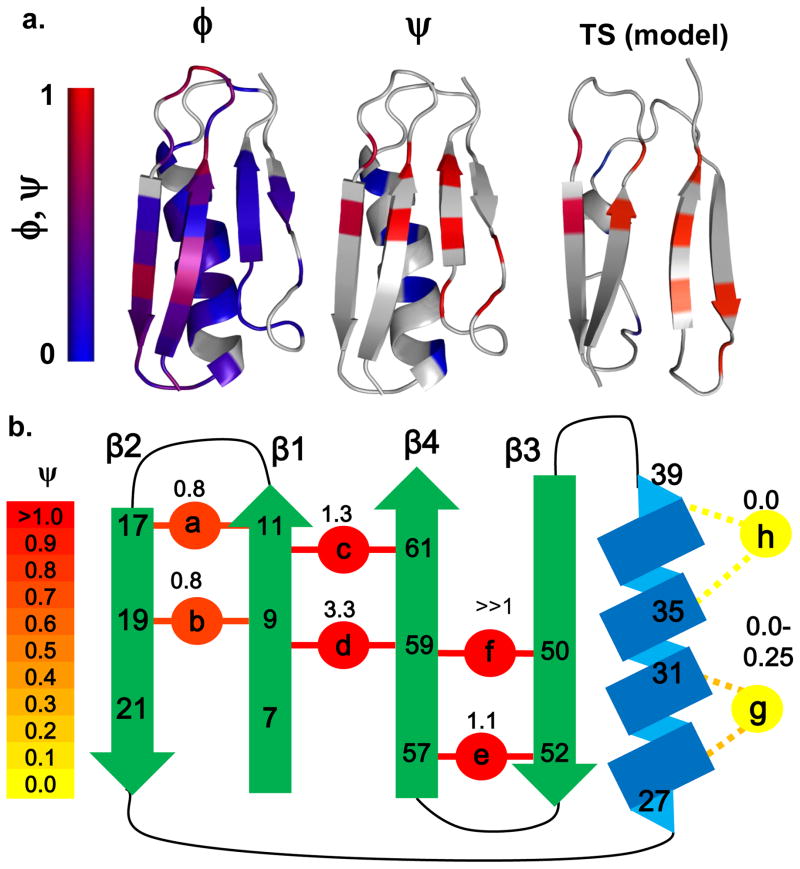
Fig. 1. BiHis sites, ψ and φ values, and TSE for Protein L.
a. φ and ψ values mapped onto Protein L. The ψ are obtained from the present study, while the φ are from ref. 7. When multiple mutations are studied at a particular site, more emphasis is placed on the X-to-Ala and Ala-to-Gly comparisons for core and helical mutations, respectively. The model of the TSE is created by docking the two hairpins using the ItFix protocols. b. The locations of the biHis sites and ψ values are shown (each site is studied individually). Renderings created in PyMol.

