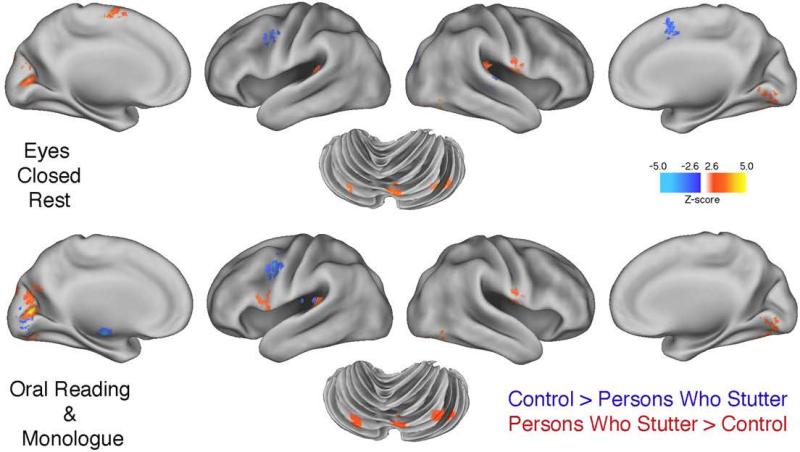
Figure 3.
The figure provides brain surface rendering of group differences in the three tasks. The upper figure shows regions more active in the PWS group (and vice versa) during eyes-closed rest (ECR) scanning conditions. The bottom panel shows group differences that are common to both speech tasks (oral reading and monologue) based on a conjunction analysis. Note the similarities of group differences for both the ECR and speech tasks in the parietal and temporal lobes, cuneus of the occipital cortex. Group differences in the cerebellum are also similar for ECR and speech tasks. A threshold of p < 0.005 was used.

