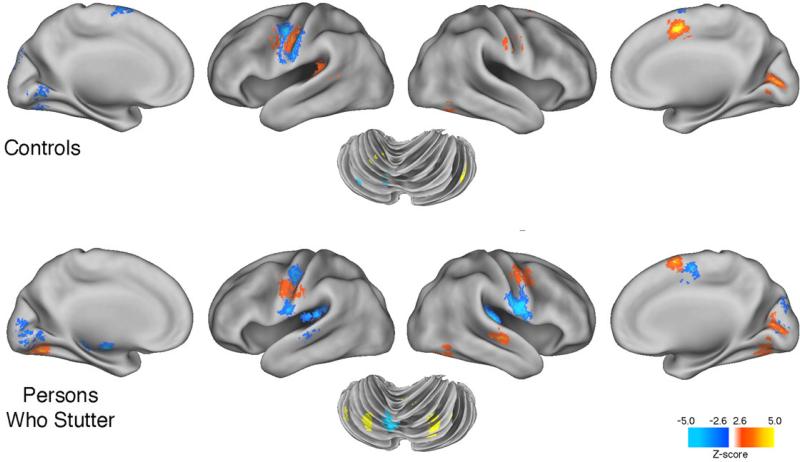
Figure 5.
The figure provides brain surface rendering of the correlation between brain activity and syllable rate in the PWS and CONT groups. The images relate to Table 6a and 6b. They show regions where there is a strong positive (red/yellow) and negative (blue) correlation with syllable rate for both the MON and ORA tasks. Prominent positive activations are evident in cerebellum, frontal gyrus and pre-SMA for the PWS group, but not so prominent in similar regions for the CONT group. precentral gyrus, STG and basal ganglia. Negatively correlated activations are much more extensive in the PWS group than the CONT group, especially in posterior insula. A threshold of p < 0.005 was used.

