
Figure 2.
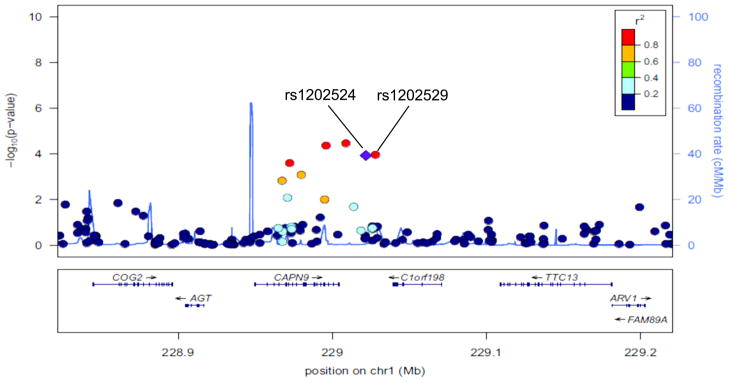
A regional plot of the −log10P-values for SNPs at 1q42.2. The LD is estimated using data from the HapMap Asian population. Also shown are recombination rates in centimorgans (cM) per megabase (Mb) and genes in the region (below) based on the March 2006 UCSC Genome Browser assembly.