
Figure 1.
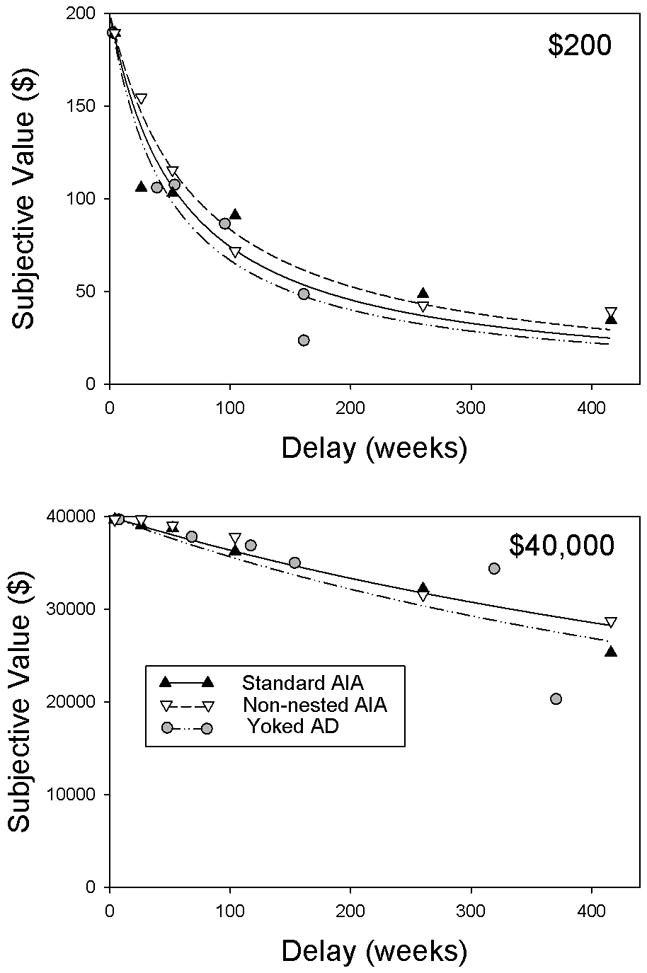
Median subjective values as a function of delay for the standard and non-nested AIA tasks and the yoked AD task in Experiment 1. The top and bottom panels show the data from the $200 and $40,000 delayed amount conditions, respectively. The curves represent the best-fitting hyperbolas.