

Abstract
Objectives
Biomarkers of inflammation, including C-reactive protein (CRP) and α1-acid glycoprotein (AGP), have tremendous potential in anthropological, public health, and nutrition research as objective indicators of acute infection; however, their utility is limited by the lack of widely-agreed upon, reliable cutpoints to define infection. We assessed the sensitivity and specificity of CRP and AGP for identifying acute infectious disease episodes among children in the Kilimanjaro region of Tanzania.
Methods
Data were available from 43 3 to 5 year old children. CRP and AGP were measured in capillary whole dried blood spots. Two-week morbidity history interviews with children’s primary caregivers were used to detect recent episodes of acute infectious disease. Specimens and morbidity history interviews were collected from each child on 1 (n=13) or 2 (n=30) occasions for 73 paired interviews and specimens.
Results
We evaluated CRP and AGP for identifying acute infection (report of fever, diarrhea, or vomiting in the last week): CRP ≥ 1.1 mg/L had sensitivity of 57.14% and specificity of 86.44%; AGP ≥ 0.76 g/L had sensitivity of 57.14% and specificity of 72.41%. The combined definition (AGP ≥ 0.76 g/L or CRP ≥ 1.1 mg/L) had sensitivity of 71.43% and specificity of 70.69%.
Conclusions
Among children in Kilimanjaro, Tanzania, assessed in whole blood stored as dried blood spots, AGP ≥ 0.76 g/L or CRP ≥ 1.1 mg/L provided the best definition of acute infection. Whether this definition is appropriate for use in other populations remains to be determined.
Keywords: Biomarker, C-reactive protein, α1-acid glycoprotein, Cutpoint, Acute infection
C-reactive protein (CRP) and α1-acid glycoprotein (AGP; also called orosomucoid) are acute phase reactants and biomarkers of inflammation. CRP binds to the surface of bacterial and damaged host cells, activates complement, and facilitates phagocytosis; the physiological role of AGP in the acute phase response is not yet well-understood. Production of these proteins increases dramatically during the acute phase response to infection (Vigushin et al., 1993; Fournier et al., 2000; Pepys and Hirshfield, 2003).
CRP and AGP stand to be useful biomarkers of acute infectious disease (ID): they are physiologically-based and objective, and not subject to variability in reporting of ID symptoms; they can be elevated in the absence of clinical symptoms, allowing for detection of sub-clinical ID; and they remain elevated in the presence of interventions (e.g., antipyretics) which might obscure other indicators. They can be measured in blood collected by finger stick and stored as dried blood spots (DBS), facilitating use among young children and in challenging field settings. However, the utility of CRP and AGP is limited by the lack of reliable and agreed-upon cutpoints defining acute ID.
Multiple conventions have developed for using CRP and AGP to define acute infection, summarized in Table 1. The most widely-used biomarker definition of acute infection is CRP ≥ 10 mg/L (e.g., Frohlich et al., 2000; Pearson et al., 2003; Cushman et al., 2005). Early CRP assays could not detect concentrations lower than ~10 mg/L, and, for this reason, 10 mg/L is considered the upper limit of the normal range of CRP (Wilkins et al., 1998); values over this cutpoint are assumed to reflect acute infection. A better means of selecting cutpoints would be to consider their sensitivity and specificity for acute infection. Such analysis has been performed for CRP, but has focused on distinguishing bacterial from viral infections among severely ill children; cutpoints suggested by such analyses, ranging from 10–70 mg/L (McWilliam and Riordan, 2010), are unlikely to be useful outside of a clinical setting.
Table 1.
Utilization of CRP and AGP to identify acute infection
| Objective | Definition of acute infection | Basis for definition | References | |
|---|---|---|---|---|
| CRP | AGP | |||
| Describing background inflammation (e.g., studies of cardiovascular disease risk and inflammation) | ≥ 10 mg/L | NA | Conventional normal range (based on the lower limit of detection of early CRP assays, 10 mg/L) | Wilkins et al., 1998 |
| Clinical assessment (of severe infectious disease episodes) | ≥ 10 mg/L–70 mg/L | NA | Sensitivity and specificity for severe disease (e.g., distinguishing bacterial from viral pneumonia or meningitis among febrile children) | McWilliam and Riordan, 2010 |
| Eliminating individuals undergoing acute infection from analysis (e.g., studies of micronutrient deficiency employing biomarkers influenced by the acute phase response) | ≥ 5 mg/L–10 mg/L | ≥ 1.2 g/L | Conventional or observed normal range |
Shapiro and Shenkin, 1989 Wilkins et al., 1998 Filteau et al., 1993 |
| Identifying acute infection among a population-based sample | ≥ 2 mg/L | NA | Positive association with reported infectious disease symptoms | McDade et al., 2008 |
Efforts to employ biomarkers to identify acute ID are further complicated by variability in specimen type. In western research settings, serum is the most commonly analyzed fluid; population-based studies in the developing world are increasingly employing DBS. Although high correlation between serum and DBS CRP values is reported (Pearson R = 0.96, McDade et al., 2004; Pearson R = 0.979, Brindle et al., 2010), DBS estimates are consistently lower than serum, suggesting a recovery of ~69% (Brindle et al., 2010). For this reason, definitions of elevated CRP or AGP based on serum may not transfer perfectly to DBS. McDade and colleagues (2008) and Wander and colleagues (2009) defined acute ID as CRP > 2.0 mg/L measured in DBS. This cutpoint, while associated with report of ID symptoms (McDade et al., 2008), was not explicitly selected to optimize sensitivity and specificity for ID episodes.
We assessed sensitivity and specificity of CRP and AGP measured in DBS for acute ID among children in Kilimanjaro, Tanzania, and identified appropriate cutpoints. We compared CRP and AGP definitions of acute ID against the standard of a morbidity history interview. Although imperfect, morbidity histories provided a means of identifying acute ID episodes for the purpose of selecting cutpoints for biomarker definitions of acute ID.
METHODS
Data were collected in spring, 2008, among children living in Kilimanjaro, Tanzania. A census of all 3 to 5 year-old children in the study area was conducted and a random sample of 50 were invited to participate. After securing parents’ informed consent, a capillary blood sample and two-week morbidity history were collected for each child. When possible, children were revisited after two weeks and a second sample and morbidity history collected. Procedures were approved by the Institutional Review Board of the University of Washington and the Tanzania National Institute for Medical Research.
Capillary blood was collected by finger stick with a sterile lancet. Blood drops were allowed to fall freely from the child’s finger onto filter paper (Whatman #903 Specimen Collection Paper). DBS specimens were dried at room temperature for ~ 24 hours and stored at ~−20°C in the field (≤ 6 weeks) until shipped on dry ice to the University of Washington, where they were stored at ~−20°C until assay.
Each child’s primary caregiver was asked to report symptoms of illness observed in the child in the previous two weeks, and specifically to report the following: fever, diarrhea, vomiting, coughing, sneezing, headache, stomachache. Caregivers were asked when, relative to day of interview, each symptom was first, and most recently, observed.
CRP was assessed with an enzyme immunoassay (Brindle et al., 2010). AGP was assessed with a commercial enzyme immunoassay kit (GenWay Biotech). Specimens that fell below the assay’s range of detection were assigned the value of the assay’s lower limit of detection (0.05 mg/L for CRP; 0.22 g/L for AGP); those above the range of detection were reanalyzed at higher dilution and assigned the value of the upper limit of detection (12.8 mg/L for CRP; 1.3 g/L for AGP) if they remained above the detection range. Coefficients of variation (CV) were estimated for the assay runs used in this analysis (4 plates CRP; 2 plates AGP) using a variance components model (Rodbard, 1974); low and high CRP assay control CVs were 4.45% and 2.51%, respectively, within assays, and 12.16% and 4.01% between assays. AGP within assay CVs were 6.20% and 4.00% and between assay CVs were 7.13% and 0.53%, respectively, for low and high controls.
Analyses were conducted in Stata 10.0 (StataCorp, College Station, Texas). We evaluated sensitivity, specificity, positive predictive value (PPV), and negative predictive value (NPV) of all CRP and AGP cutpoints for reported ID symptoms. Sensitivity was defined as the fraction of morbidity history positives captured by a biomarker definition of ID; specificity, the fraction of morbidity history negatives excluded by a biomarker definition of ID; PPV, the fraction of those captured by a biomarker definition of ID who were morbidity history positive; NPV, the fraction of those excluded by a biomarker definition of ID who were morbidity history negative (Table 2). Receiver operating characteristic (ROC) curves were constructed for each biomarker. ROC curves graph sensitivity on the y-axis against 1-specificity on the x-axis: a straight line from (0,0) to (1,1) represents the expected performance of random “guessing”; the extent to which the ROC curve falls above this line represents the biomarker’s performance.
Table 2.
Definition of sensitivity, specificity, positive predictive value (PPV), and negative predictive value (NPV)
| Biomarker | Morbidity history | |
|---|---|---|
| Positive | Negative | |
| Positive | a | b |
| Negative | c | d |
Sensitivity = a/(a + c); Specificity = d/(b + d)
PPV = a/(a + b); NPV = d/(c + d)
The standard for an episode of acute ID was restricted to symptoms most consistently associated with elevation in AGP and CRP, and defined as report of fever, vomiting, or diarrhea within the previous week in the morbidity history (Christian et al., 1998; Filteau et al., 1993, 1995).
The best combination of sensitivity and specificity was sought by identifying all cutpoints with specificity ≥ 70% and sensitivity ≥ 50% and selecting the cutpoint maximizing both values within this range. We chose a higher minimum acceptable specificity than sensitivity to err on the side of excluding borderline or ambiguous levels of CRP or AGP from the definition of acute ID.
RESULTS
43 children participated. Mean age was 4.48 years; 55.8% were female. A total of 73 paired blood specimens and morbidity histories were available; adequate specimen was available to evaluate CRP for 73 and AGP for 72. The distributions of CRP and AGP (on collection day 1) are shown in Figure 1. Fever, vomiting, or diarrhea in the previous week were reported in 14 of 73 (19.18%) morbidity histories.
Figure 1.

Distribution of A) C-reactive protein (CRP; mg/L), and B) α1-acid glycoprotein (AGP; g/L) among 43 children in Kilimanjaro (from the first DBS collection only).
Sensitivity and specificity of CRP and AGP (left) and ROC curves (right) are shown in Figure 2. CRP ≥ 1.1 mg/L (sensitivity, 57.14%; specificity, 86.44%; PPV, 50.00%; NPV, 89.47%) and AGP ≥ 0.76 g/L (sensitivity, 57.14%; specificity, 72.41%; PPV, 33.33%; NPV, 87.50%) were selected as the best cutpoints for acute ID. Concordance between CRP ≥ 1.1 mg/L and AGP ≥ 0.76 g/L is shown in Table 3 (80.56%; kappa = 0.5227). The definition CRP ≥ 1.1 mg/L and AGP ≥ 0.76 g/L had sensitivity of 42.86% and specificity of 87.93% (PPV = 46.15%; NPV = 86.44%); the definition CRP ≥ 1.1 mg/L or AGP ≥ 0.76 g/L had sensitivity of 71.43% and specificity of 70.69% (PPV = 37.04%; NPV = 91.11%).
Figure 2.
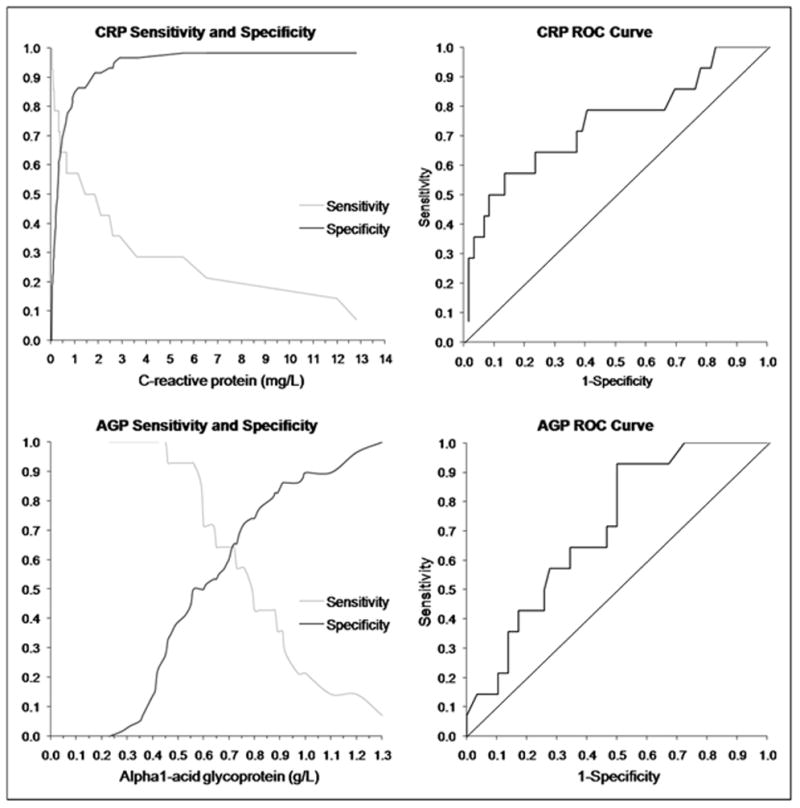
Sensitivity (fraction of true positives included) and specificity (fraction of true negatives excluded) of C-reactive protein (CRP; above left) and α1-acid glycoprotein (AGP; below left) for identifying episodes of acute infection, and receiver operating characteristic (ROC) curve for CRP (above right) and AGP (below right).
Table 3.
Concordance between elevated CRP and elevated AGP.
| AGP ≥ 0.76 g/L | CRP ≥ 1.1 mg/L
|
||
|---|---|---|---|
| No | Yes | Total | |
| No | 45 (62.50%) | 11 (15.28%) | 56 |
| Yes | 3 (4.17%) | 13 (18.06%) | 16 |
| Total | 48 | 24 | 72 |
Concordance = 80.56%; kappa = 0.5227
DISCUSSION
Among children in Kilimanjaro, Tanzania, we measured two biomarkers of inflammation, CRP and AGP, in DBS, assessed their sensitivity and specificity for acute ID, and selected definitions of elevation. CRP ≥ 1.1 mg/L and AGP ≥ 0.76 g/L were the best cutpoints for identifying acute ID. The combination of these two criteria, CRP ≥ 1.1 mg/L or AGP ≥ 0.76 g/L, offers better sensitivity with lower, but acceptable, specificity. These definitions are specific to research employing DBS among young children. Future assessment will be needed to verify their appropriateness for populations outside of East Africa, and to validate their use with other DBS assays or specimen types.
We employed a relatively small sample. The standard we employed, report of ID symptoms, is imperfect, subject to under-reporting among the sickest children (e.g., Panter-Brick et al., 2001), and the decision to include only fever, vomiting, and diarrhea in the standard was somewhat arbitrary. However, symptom report is an appropriate, if imperfect, standard: both AGP and CRP are consistently positively associated with reported ID symptoms (fever, diarrhea or dysentery, vomiting, headache, cough) in the previous week (Christian et al., 1998; Filteau et al., 1993, 1995; McDade et al., 2008), and only those symptoms most consistently associated with elevated CRP and AGP were included in the definition of ID (Christian et al., 1998; Filteau et al., 1993, 1995).
The described cutpoints for CRP and AGP offer the optimal sensitivity and specificity for identifying episodes of acute ID among children using DBS specimens. These cutpoints, selected for their sensitivity and specificity, are an improvement over cutpoints based on convention or an observed normal range.
Acknowledgments
We thank study participants and their families for their participation. Funding for the conduct of this research was provided by the National Science Foundation (Graduate Research Fellowship to KW), the American Philosophical Society (Lewis and Clark Fund for Exploration and Field Research grant to KW), and the University of Washington Department of Anthropology (Graduate Student Pilot Research Fund grant to KW); partial support for this research was also provided by a Eunice Kennedy Shriver National Institute of Child Health and Human Development research grant to the Center for Studies in Demography and Ecology at the University of Washington. We thank the physicians and staff of Nshara Community Medical Centre, in particular Dr. Amini Uronu, Dr. Justo Kwayu, and Zawia Massawe, and Bettina Shell-Duncan (University of Washington Department of Anthropology) for support and guidance during the conduct of this research, and Anita Rocha (University of Washington Center for Studies in Demography and Ecology) for help in preparation of this manuscript. Finally, we thank anonymous reviewers for guidance in editing this manuscript.
References
- Brindle E, Fujita M, Shofer J, O’Connor KA. Serum, plasma, and dried blood spot high-sensitivity C-reactive protein enzyme immunoassay for population research. J Immunol Methods. 2010;362:112. doi: 10.1016/j.jim.2010.09.014. [DOI] [PMC free article] [PubMed] [Google Scholar]
- Christian P, Schulze K, Stoltzfus RJ, West KP., Jr Hyporetinolemia, illness symptoms, and acute phase protein response in pregnant women with and without night blindness. Am J Clin Nutr. 1998;67:1237. doi: 10.1093/ajcn/67.6.1237. [DOI] [PubMed] [Google Scholar]
- Cushman M, Arnold AM, Psaty BM, Manolio TA, Kuller LH, Burke GL, Polak JF, Tracy RP. C-reactive protein and the 10-year incidence of coronary heart disease in older men and women. Circulation. 2005;112:25. doi: 10.1161/CIRCULATIONAHA.104.504159. [DOI] [PubMed] [Google Scholar]
- Filteau SM, Morris SS, Abbott RA, Tomkins AM, Kirkwood BR, Arthur P, Ross DA, Gyapong JO, Raynes JG. Influence of morbidity on serum retinol of children in a community-based study in northern Ghana. Am J Clin Nutr. 1993;58:192. doi: 10.1093/ajcn/58.2.192. [DOI] [PubMed] [Google Scholar]
- Filteau SM, Morris SS, Raynes JG, Arthur P, Ross DA, Kirkwood BR, Tomkins AM, Gyapong JO. Vitamin A supplementation, morbidity, and serum acute-phase proteins in young Ghanaian children. Am J Clin Nutr. 1995;62:434. doi: 10.1093/ajcn/62.2.434. [DOI] [PubMed] [Google Scholar]
- Fournier T, Medjoubi-N N, Porquet D. Alpha-1-acid glycoprotein. Biochim Biophys Acta. 2000;1482:57. doi: 10.1016/s0167-4838(00)00153-9. [DOI] [PubMed] [Google Scholar]
- Frohlich M, Imhof A, Berg G, Hutchinson WL, Pepys MB, Boeing H, Muche R, Brenner H, Koenig W. Association between C-reactive protein and features of the metabolic syndrome: a population-based study. Diabetes Care. 2000;23:1835. doi: 10.2337/diacare.23.12.1835. [DOI] [PubMed] [Google Scholar]
- McDade TW, Burhop J, Dohnal J. High-sensitivity enzyme immunoassay for C-reactive protein in dried blood spots. Clin Chem. 2004;50:652. doi: 10.1373/clinchem.2003.029488. [DOI] [PubMed] [Google Scholar]
- McDade TW, Reyes-García V, Tanner S, Huanca T, Leonard WR. Maintenance versus growth: Investigating the costs of immune activation among children in lowland Bolivia. Am J Phys Anthropol. 2008;136:478. doi: 10.1002/ajpa.20831. [DOI] [PubMed] [Google Scholar]
- McWilliam S, Riordan A. How to use: C-reactive protein. Arch Dis Child Educ Pract Ed. 2010;95:55. doi: 10.1136/adc.2009.174367. [DOI] [PubMed] [Google Scholar]
- Panter-Brick C, Lunn PG, Baker R, Todd A. Elevated acute-phase protein in stunted Nepali children reporting low morbidity: Different rural and urban profiles. Br J Nutr. 2001;85:125. doi: 10.1079/bjn2000225. [DOI] [PubMed] [Google Scholar]
- Pearson TA, Mensah GA, Alexander RW, Anderson JL, Cannon RO, III, Criqui M, Fadl YY, Fortmann SP, Hong Y, Myers GL, Rifai N, Smith SC, Jr, Taubert K, Tracy RP, Vinicor F Centers for Disease Control and Prevention; American Heart Association. Markers of inflammation and cardiovascular disease: application to clinical and public health practice: a statement for healthcare professionals from the Centers for Disease Control and Prevention and the American Heart Association. Circulation. 2003;107:499–511. doi: 10.1161/01.cir.0000052939.59093.45. [DOI] [PubMed] [Google Scholar]
- Pepys MB, Hirschfield GM. C-reactive protein: a critical update. J Clin Invest. 2003;111:1805–1812. doi: 10.1172/JCI18921. [DOI] [PMC free article] [PubMed] [Google Scholar]
- Shapiro D, Shenkin A. A two-site immunoradiometric assay for C-reactive protein in serum. Clin Chim Acta. 1989;180:285. doi: 10.1016/0009-8981(89)90010-7. [DOI] [PubMed] [Google Scholar]
- Vigushin DM, Pepys MB, Hawkins PN. Metabolic and scintigraphic studies of radioiodinated human C-reactive protein in health and disease. J Clin Invest. 1993;91:1351. doi: 10.1172/JCI116336. [DOI] [PMC free article] [PubMed] [Google Scholar]
- Wander K, Shell-Duncan B, McDade TW. Evaluation of iron deficiency as a nutritional adaptation to infectious disease: An evolutionary medicine perspective. Am J Hum Biol. 2009;21:172. doi: 10.1002/ajhb.20839. [DOI] [PMC free article] [PubMed] [Google Scholar]
- Wilkins J, Gallimore RJ, Moore EG, Pepys MB. Rapid Automated High Sensitivity Enzyme Immunoassay of C-Reactive Protein. Clin Chem. 1998;44:1358. [PubMed] [Google Scholar]