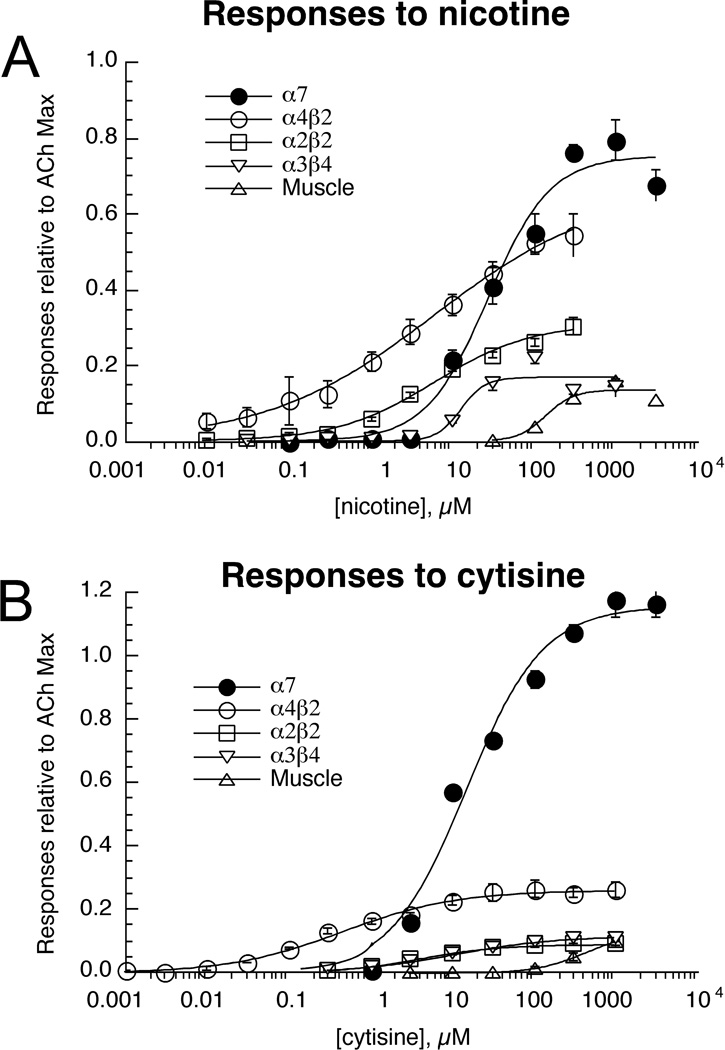
Figure 5.
Nicotine (A) and cytisine (B) concentration-response studies of zebrafish nAChR expressed in Xenopus oocytes. Data were obtained by alternating applications of ACh at fixed control concentrations (see Methods) and the test compounds at increasing concentrations. The control responses were relatively consistent throughout the entire range of test concentrations. Test responses were initially normalized relative to the ACh controls, and the data are expressed relative to the observed ACh maximum responses as determined in the experiments illustrated in Figure 3. Data plotted are for peak currents of the heteromeric receptors and net charge for α7. Each point is the average ± SEM of responses from at least four oocytes.

