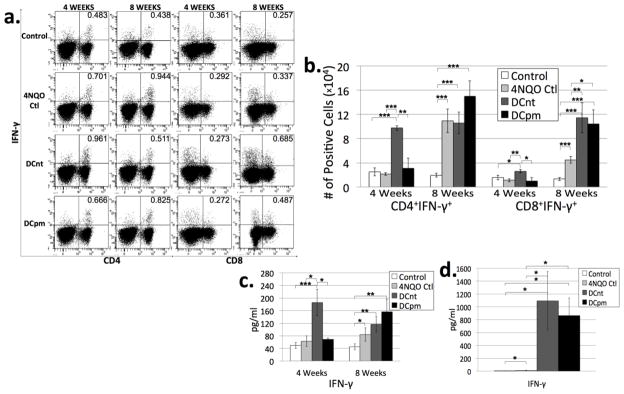
Fig 5. DCnt vaccination results in an increase in Th1 and Tc1 levels at 4 weeks, while both DCnt and DCpm vaccination result in an increase in Tc1 levels at 8 weeks compared to 4NQO-treated controls.
Representative results (a) of flow cytometric staining of cervical lymph node cells from control, 4NQO-treated control (4NQO Ctl), DCnt-vaccinated (DCnt) and DCpm-vaccinated (DCpm) mice at 4 and 8 weeks post-first vaccination with at least 5 mice per group. Total numbers of populations (b) were determined by multiplying the percent positive by the number of cervical lymph node cells for each individual mouse. Data represent mean ± SEM. *, p < 0.05. **, p < 0.01. ***, p < 0.001 (2-tailed Student’s t-test). Cytometric bead array analysis (c) of supernatant of 4 week and 8 week control, 4NQO Ctl, DCnt, and DCpm mouse cervical lymph node cells after stimulation for four hours with PMA and ionomycin, with at least 5 mice per group. Data represent mean ± SEM. *, p < 0.05. **, p < 0.01. ***, p < 0.001 (2-tailed Student’s t-test). Cytometric bead array analysis (d) of supernatant of 8 week control, 4NQO Ctl, DCnt, and DCpm mouse cervical lymph node cells after 3 day stimulation with anti-CD3/anti-CD28 beads with at least 4 mice per group. Data represent mean ± SEM. *, p < 0.05 (2-tailed Student’s t-test). Results for pg/ml of IFN-γ released after 3 day stimulation (Ctl: 4.73 ± 1.31; 4NQO Ctl: 11.85 ± 2.53; DCnt: 1095.05 ± 452.47; DCpm: 864.98 ± 274.21).

