
Figure 5.
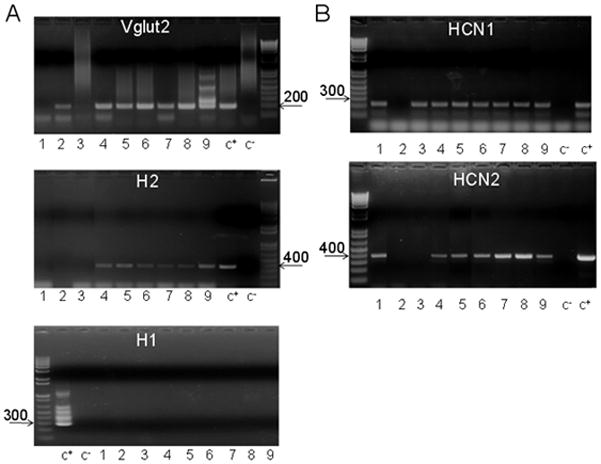
H2, Vglut2, HCN1 and HCN2 transcripts in MPON neurons recorded in slices from transgenic GAD65-GFP mice.
A. Agarose gels illustrating the expression of H2 (upper), Vglut2 (middle) and H1 (lower) in a batch of nine (1–9) recorded MPON neurons. The expected sizes of the PCR products are (in base pairs) 366, 186 and 286, respectively. B. Agarose gels illustrating the expression of HCN1 (up), HCN2 (middle) and HCN3 (lower) in the same neurons as in A. The expected sizes of the PCR products are (in base pairs) 220, 370 and 550, respectively. A,B. Negative (−) control was amplified from a harvested cell without reverse-transcription, and positive control (+) was amplified using 1 ng of hypothalamic mRNA.