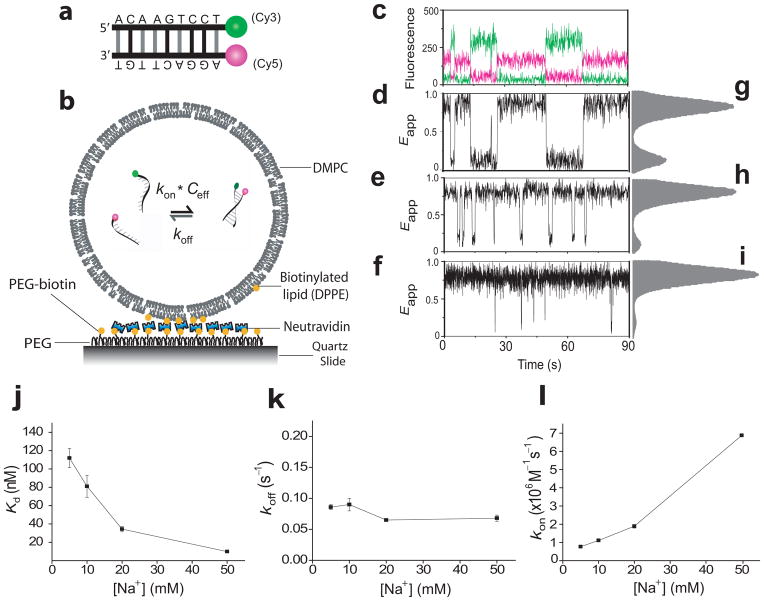
Figure 1.
Single-molecule porous vesicle encapsulation assay. (a) Schemes for the 9 bp DNA duplex and (b) DNA encapsulation; (c–l) Salt dependent dynamics for 9 bp DNA in 200 nm vesicles: single molecule time traces (c, d, e, f), and histograms from over 100 vesicles (g, h, i), at 5 mM (c, d, g), 20 mM (e, h), and 50 mM Na+ (f, i). Kd, koff, and kon vs [Na+] (j, k, l); 541 vesicles were used to calculate the rates in j, k and l. All error bars represent standard error from triplicate experiments at 23 °C. In c, green curve denotes the donor intensity and red the acceptor intensity.

