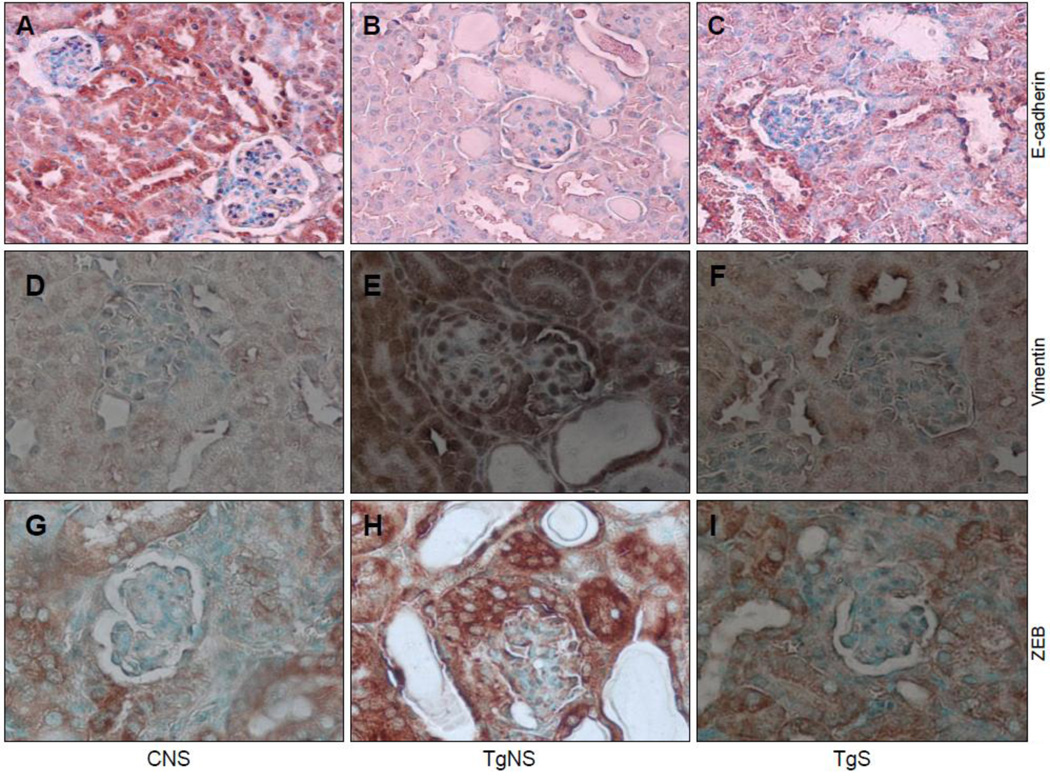
Figure 4. Sirolimus modulates renal cell expression of E-cadherin, vimentin, and ZEB1/2 in HIVAN mice.
Renal cortical sections from CNS, TgNS, and TgS from the protocol A (n=6) were immunolabeled for E-cadherin, vimentin, and ZEB1/2.
A–C. Representative microphotographs of cortical sections of CNS, TgNS, and TgS labeled for E-cadherin. Renal epithelia in CNS (A) and TgS (C) showed +ve staining (dark brown, cytoplasmic) for E-cadherin; whereas, renal cells in TgNS (B) showed diminished staining for E-cadherin. X100
D–F. Representative microphotographs of cortical sections of CNS, TgNS, and TgS immunolabeled for vimentin. Renal epithelia in TgNS (E) showed +ve staining (brown, cytoplasmic) for vimentin; whereas, renal cells in CNS (D) and TgS (E) showed attenuated staining for vimentin. X100
G–I. Representative microphotographs of cortical sections of CNS, TgNS, and TgS immunolabeled for ZEB1/2. Renal epithelia in TgNS (E) showed +ve staining (brown, cytoplasmic) for ZEB1/2; whereas, renal cells in CNS (D) and TgS (E) showed diminished staining for ZEB1/2. X100

