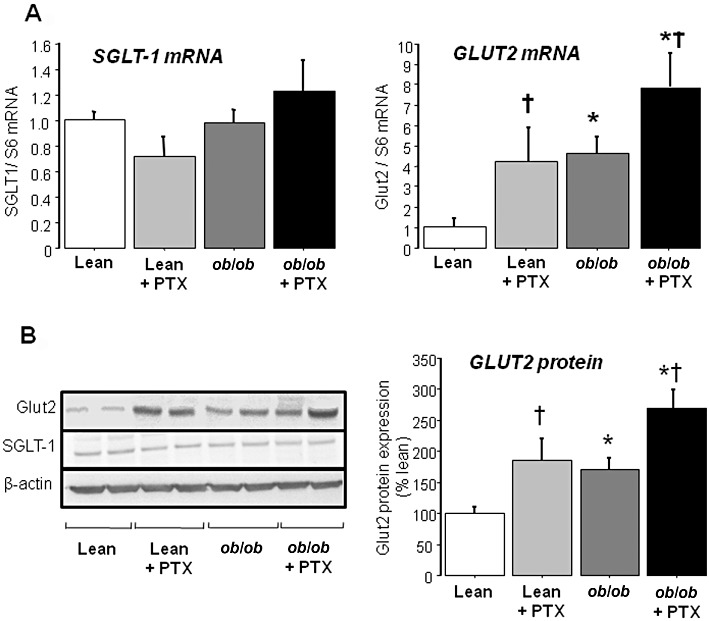
Figure 3.

mRNA and protein expression of GLUT2 and SGLT-1 in the jejunum of lean and obese mice treated with pentoxifylline (PTX) or placebo for 3 weeks. (A) mRNA expression of GLUT2 and SGLT-1 in the jejunum assessed by real-time quantitative PCR analysis. Results are means ± SEM for six to eight mice per group. (B) Protein expression of GLUT2 and SGLT-1 in the jejunum assessed by Western blotting. Bar graph represents GLUT2 protein expression in six different mice per group. * significantly different from lean mice (P < 0.05); † significantly different from untreated mice (P < 0.05).
