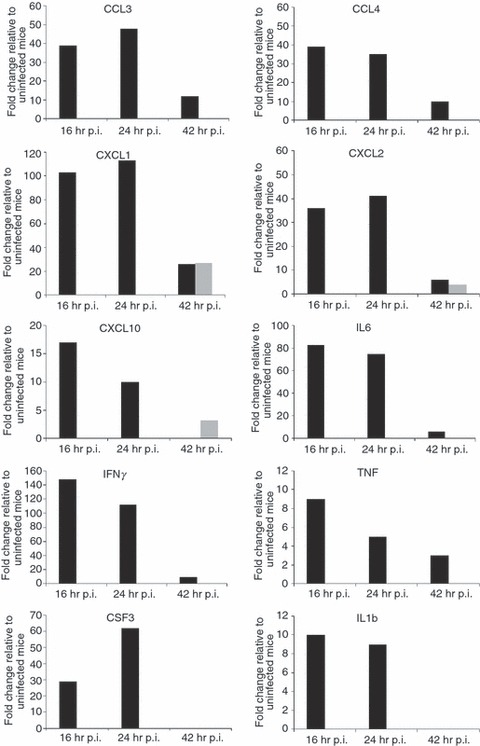
Figure 8.

Expression profiles of ‘core immune response’ genes in the Burkholderia pseudomallei-infected spleen. Several ‘common core immune response’ gene expression profiles (fold change relative to uninfected mice) during acute melioidosis infection in spleen for the streptozotocin (STZ) -diabetic (grey bars) and normoglycaemic infection models (black bars), respectively. Data for the acute normoglycaemic infection model is adopted from Chin et al.18
