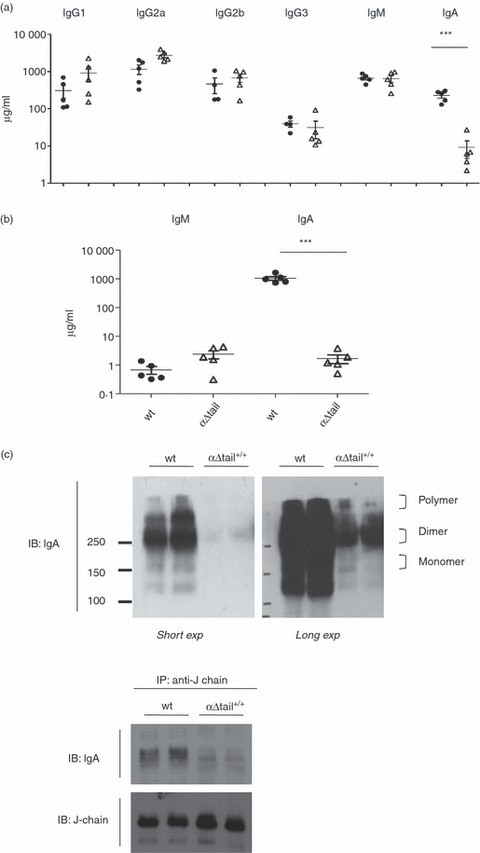
Figure 3.

Analysis of mouse immunoglobulin production in sera and secretions. (a) Total endogenous immunoglobulin production was estimated by ELISA in sera from αΔtail+/+ (Δ) compared with wild-type (wt) mice (•). (b) Amount of total IgA and IgM antibodies in digestive secretion of wt (•) and α-Δtail+/+ mice (Δ), as determined by ELISA; n = 5 per group. For all figure, asterisks mark statistically significant differences with controls (Student's t-test, *** for P < 0·001). The vertical axis is logarithmic and values are indicated as μg/ml. (c) (Top) Protein expression level of polymeric, dimeric and monomeric IgA forms in sera was examined by non-reducing SDS–PAGE (two individual sera per group). The protein expressions shown are both a short exposure (short exp) and a long exposure (long exp) of the same blot. The positions of different forms were indicated. (Bottom) Sera from wt and αΔtail+/+ mice were subjected to immunoprecipitation (IP) using anti-mouse J-chain and the precipitates were subjected to immunoblotting (IB) with indicated antibodies (two individual sera per group).
