
Figure 5.
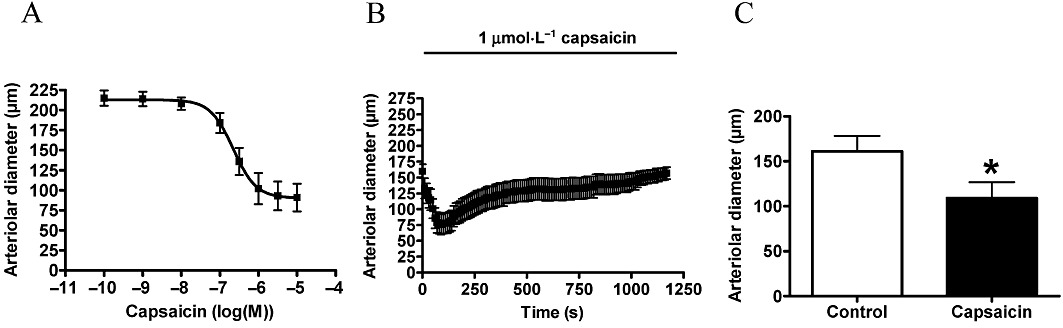
Pharmacological characterization of vascular responses to capsaicin. Experiments were performed on cannulated arteries as mentioned above. First, a cumulative dose-response curve was obtained (A, n = 7). Next on a separate set of arteries, the kinetics of response were measured by the application of 1 µM capsaicin for 20 min. Arteriolar diameter was measured at 10 s intervals (B, n = 9). After this 20 min treatment, the arteries were washed and were incubated in PSS solution for 40 min (regeneration). At the end of regeneration, vasoconstriction to the same dose of capsaicin (1 µM) was measured to determine tachyphylaxis (C, n = 7). Values are mean ± SEM, significant difference (P < 0.05) is represented by an asterisk.