
Figure 4.
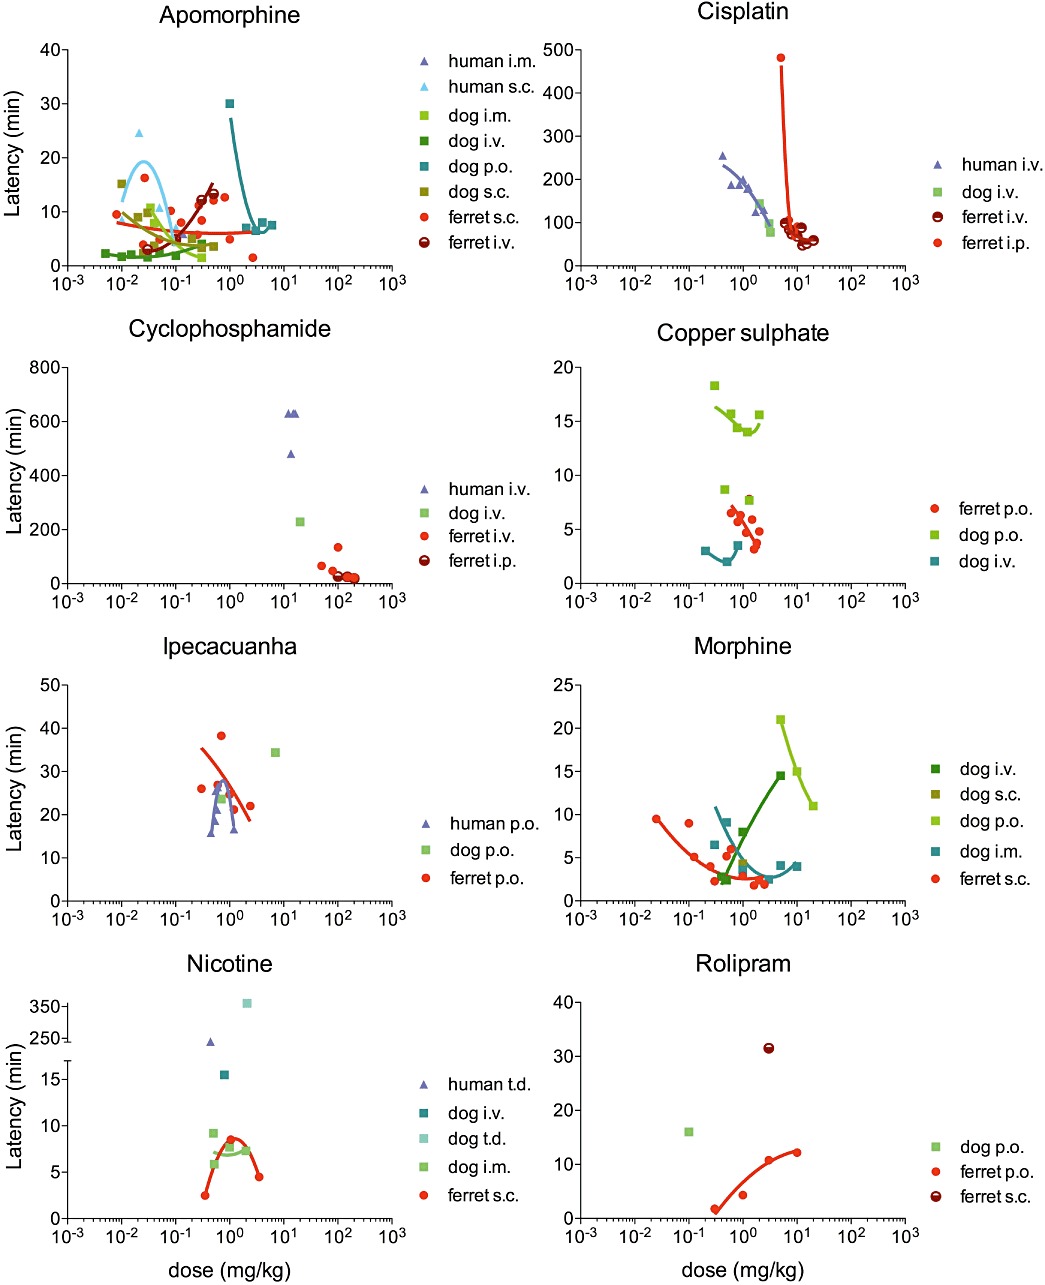
Latency to the onset of the emetic response for each drug, in human, dog and ferret. The latency at each dose is plotted as weighted mean. The data were fitted using a second-order polynomial curve.
Official websites use .gov
A
.gov website belongs to an official
government organization in the United States.
Secure .gov websites use HTTPS
A lock (
) or https:// means you've safely
connected to the .gov website. Share sensitive
information only on official, secure websites.
Latency to the onset of the emetic response for each drug, in human, dog and ferret. The latency at each dose is plotted as weighted mean. The data were fitted using a second-order polynomial curve.