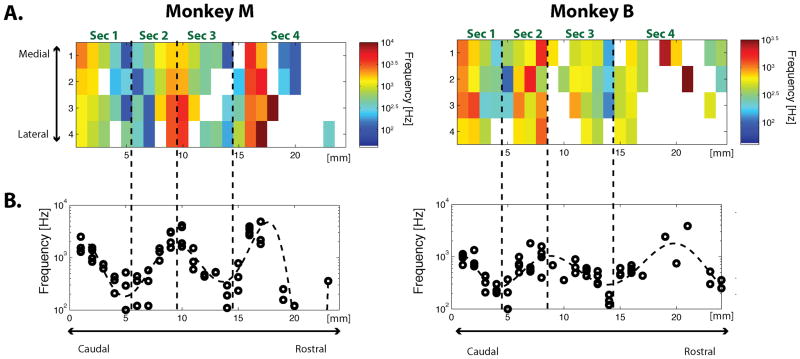
Figure 3. Tonotopic map on the STP obtained with high-gamma power.
A. The spatial map of the estimated CFs for each monkey (Left: Monkey M; Right: Monkey B). The CFs are color coded. White indicates site without significant frequency tuning. B. The CFs projected onto their caudorostral locations. Each CF from A is plotted on the vertical axis and its corresponding caudorostral location is plotted on the horizontal axis. Abbreviation: Sec, Sector (see main text for definition of each sector). (See also Figure S3 and Table S1 for supplemental information for this figure.)

