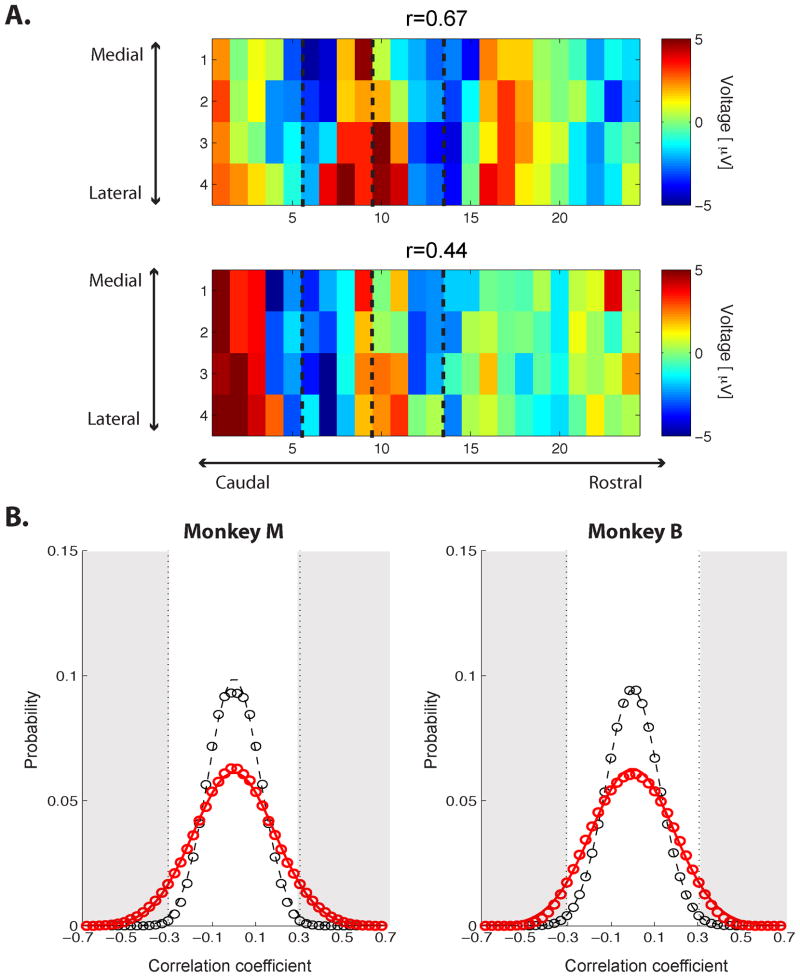
Figure 4. The spatial structure of the spontaneous high-gamma band voltage is correlated with the CF map.
A. Two time frames from spontaneous high-gamma voltage illustrating the significant correlations between spontaneous activity and the CF map (Monkey M: Top, r = 0.67; Bottom, r = 0.44). The dashed lines indicates the boundaries of different sectors as defined in Figure 3A. B. Distributions of correlation between the CF map and spontaneous activity (Left: Monkey M, Right: Monkey B). Red, the distribution of correlation coefficients between the CF map and spontaneous-voltage time frames over the entire recording session. Black, the control distribution created by correlating with randomized CF maps (with 10 different randomizations). Each distribution was fitted by a Gaussian, indicated by the lines. The significance level was computed from the control distribution for p < 0.01 (two-sided, p < 0.005 on each side). The gray area indicates the correlation coefficients satisfying this significance level.

