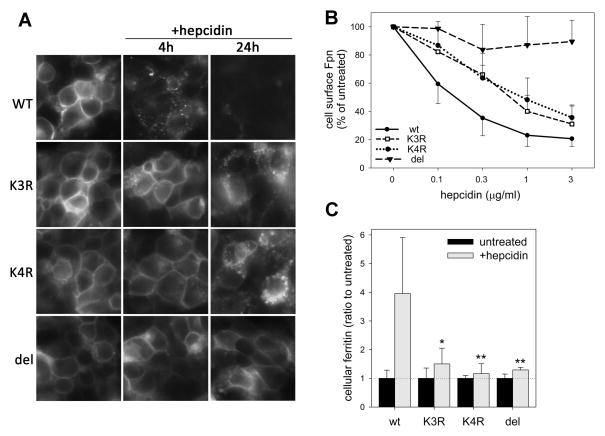
Figure 3. Lysine substitutions in the third intracellular loop of Fpn interfere with hepcidin-induced Fpn endocytosis and cellular iron retention.
Stably transfected HEK293 cells were induced with Dox to express WT, K3R, K4R or del229-269 Fpn-GFP. Dox was washed off prior to adding hepcidin. A: Cells were treated with 1 μg/ml (360 nM) hepcidin and Fpn-GFP location assessed at 4 and 24 h by fluorescent microscopy. B: Cells were treated with indicated hepcidin concentrations. After 4 h, cell surface Fpn was detected by staining with anti-human Fpn Ab against an extracellular loop of Fpn (M1), followed by the secondary Ab conjugated to PE. Fluorescence was quantified by flow cytometry and expressed as % fluorescence of untreated samples. Each point represents the mean and standard deviation of 3 independent experiments. Each of the mutant curves (K3R, K4R or DEL) significantly differed from the WT (p<0.001, two-way ANOVA). C: Cells expressing WT or mutant Fpn-GFP were incubated without or with 0.2 μg/ml (72 nM) hepcidin for 24 h. Cell lysates were assayed for ferritin. Fold increase in ferritin after hepcidin treatment is shown as a mean and standard deviation of at least 6 separate measurements. *p=0.003 and **p=0.001 by Mann-Whitney Rank Sum Test for the comparison of the hepcidin-treated mutant with the hepcidin-treated WT cells. For K3R, K4R or DEL mutants, no significant difference in ferritin levels was observed between hepcidin-treated or untreated cells.

