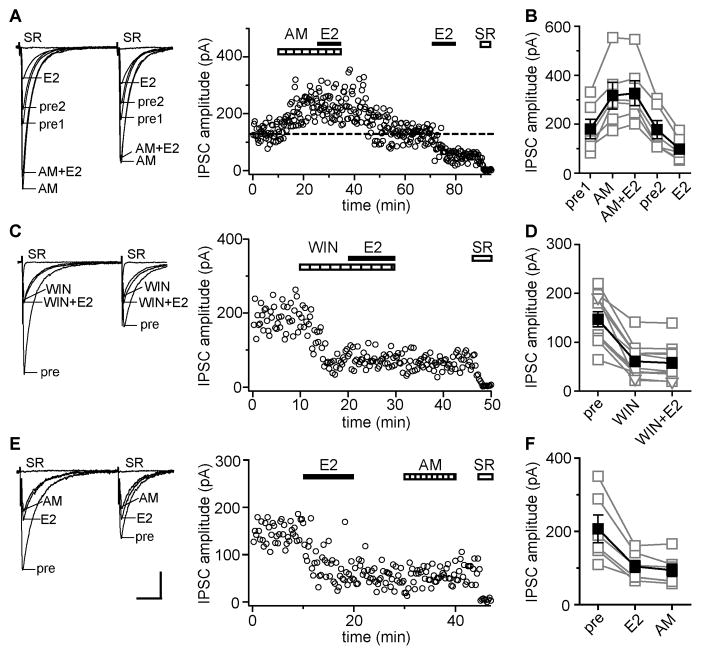
Figure 2. Estradiol-induced IPSC suppression requires CB1Rs for induction, but not maintenance.
(A) Recording of AM251 (CB1R antagonist, AM, 10 μM)-sensitive IPSCs in which E2 was applied in the presence then absence of AM; individual traces and time course are shown. Each point is an individual sweep and SR 95531 (SR, 2 μM) applied at the end of the experiment blocked IPSCs (also in C, E). Dotted line shows average IPSC amplitude during 2 min before the second E2 application. AM blocked E2-induced IPSC suppression.
(B) Group IPSC amplitude data for all experiments as in A (n=6). Connected open symbols are individual cells; filled symbols are mean ± SEM in each condition for all cells (also in D, F)
(C) Recording of WIN 55,212-2 (CB1R agonist, WIN, 5 μM)-sensitive IPSCs; individual traces and time course are shown. WIN occluded E2-induced IPSC suppression.
(D) Group IPSC amplitude data for all experiments as in C (n=11).
(E) Recording of E2-sensitive IPSCs in which AM was applied after the E2-induced decrease in IPSC amplitude was established; individual traces and time course are shown. AM applied after E2 washout had no effect on IPSCs. Scale indicates 50 pA, 25 msec and also applies to A, C.
(F) Group IPSC amplitude data for all experiments as in E (n=6).

