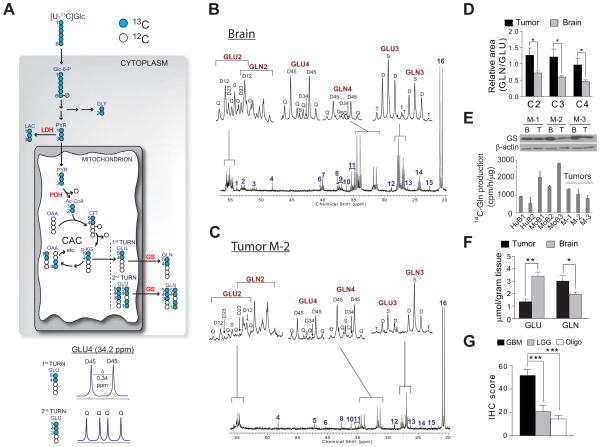
Figure 4. Metabolism of [U-13C]glucose in HOTs and surrounding brain.
(A) Illustration of [U-13C]glucose metabolism. See legend to Fig. 3A and Supplemental Experimental Procedures for details and abbreviations.
(B) Brain and (C) tumor spectra from a mouse with an M-2 HOT infused with [U-13C]glucose. Insets are glutamate (GLU) and glutamine (GLN) C2, C3 and C4.
(D) Ratio of glutamine area to glutamate area for carbons 2, 3 and 4 in tumor and surrounding brain. Data are the average and S.E.M. for six individual mice, two for each of the three HOT lines. Statistical analysis: Wilcoxon signed rank test. *, p<0.05.
(E) Top, Glutamine synthetase (GS) western blot in tumor (T) and surrounding brain (B) of HOT lines. Bottom, GS enzyme activity in two human brain samples (HuB1, HuB2), three mouse brain samples (MoB1 – MoB3), and three HOTs (M-1 to M-3). MoB3 is the brain tissue surrounding tumor M-1. Data are the average and S.D. for three replicates from each sample.
(F) Total GLN and GLU abundance in tumor and brain extracts (n=9), measured by high-performance liquid chromatography. Data are the average and S.D. *, p<0.05; **, p<0.005, Student’s t-test.
(G) Immunohistochemistry (IHC) scores for GS expression in a tissue microarray consisting of GBM (n=81), low-grade (Grade II–III) gliomas (LGG, n=37) and oligodendrogliomas (Oligo, n=33). Data are the average and S.E.M. ***, p<0.001, one-way ANOVA with Dunnett’s post-hoc test.

