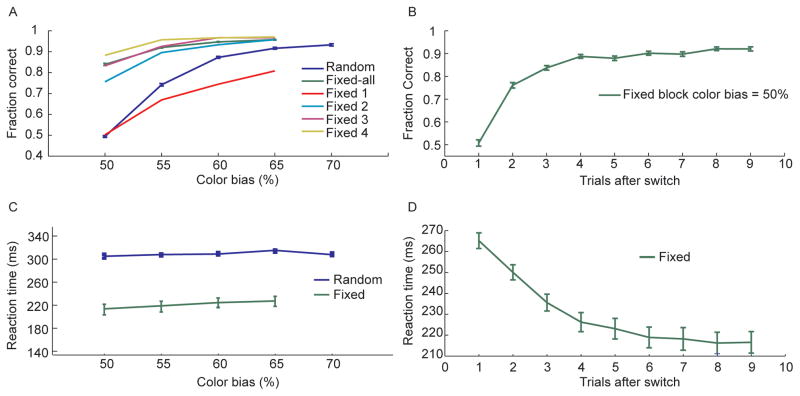
Fig. 2.
Behavioral results. A. Fraction of correct decisions as a function of color bias for random and fixed conditions. Data for the fixed condition is shown averaged across all trials of each block (green) as well as separately for the first through fourth trials after a sequence switch (Fixed 1 – Fixed 4). B. Fraction of correct decisions in the 50% color bias condition as a function of trials after the sequence switched in the fixed condition. C. Reaction time in random and fixed conditions as a function of the color bias. D. Reaction time in the fixed condition split out by trials after switch.

