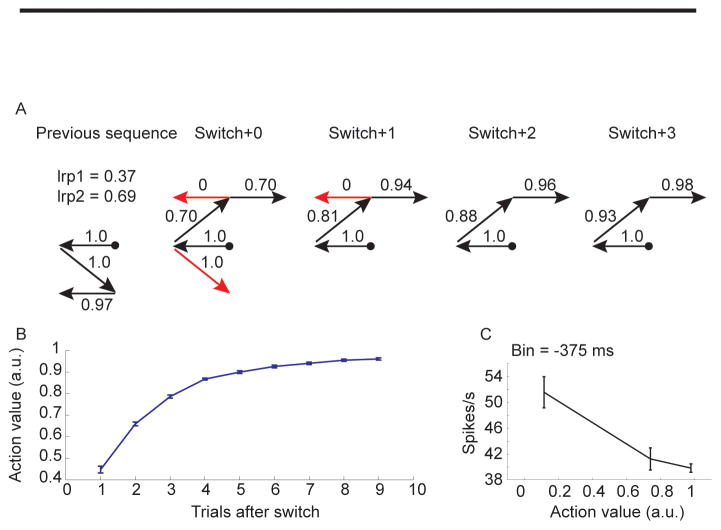
Fig. 5.
Example action value and corresponding average effect on neural activity in dSTR neuron. A. Action values extracted from the reinforcement learning algorithm for a series of movements. Example shows one trial preceding sequence switch, and four trials after the switch. Red arrows indicate incorrect movements, black arrows indicate correct movements. Trial always started at circle. B. Average action value as a function of trials after switch shows the accumulation of value across a block. C. Average response of a single example neuron 375 ms before movement onset for different action values. The response in this neuron decreased with increasing action value.

