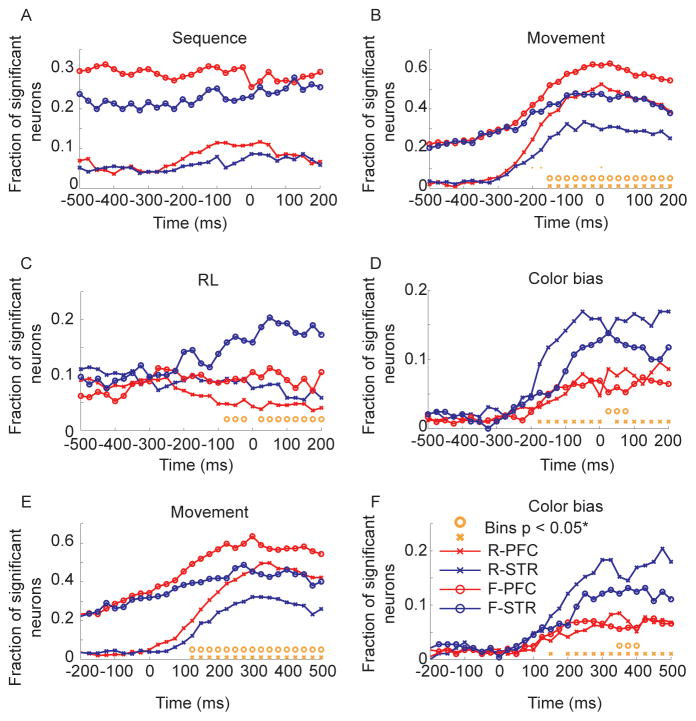
Fig. 7.
ANOVA split by task for lPFC and dSTR. Analyses in panels A-D are carried out on data aligned to movement onset (time 0 in plots). Analyses in panels E-F are carried out on data aligned to target onset (time 0 in plots). Orange circles indicate significant differences, after FDR correction, between the fraction of neurons significant in lPFC vs. dSTR in fixed condition. Orange x’s are the same for the random condition. R-lPFC (random condition, lPFC); R-dSTR (random condition, dSTR); F-lPFC (fixed condition; lPFC); F-dSTR (fixed condition, dSTR). A. Effect of sequence. B. Effect of RL. C. Effect of movement. Orange dots at y = 0.1 in only this panel represent significant a interaction between task and region. D. Effect of color bias. E. Effect of movement. F. Effect of color bias.

