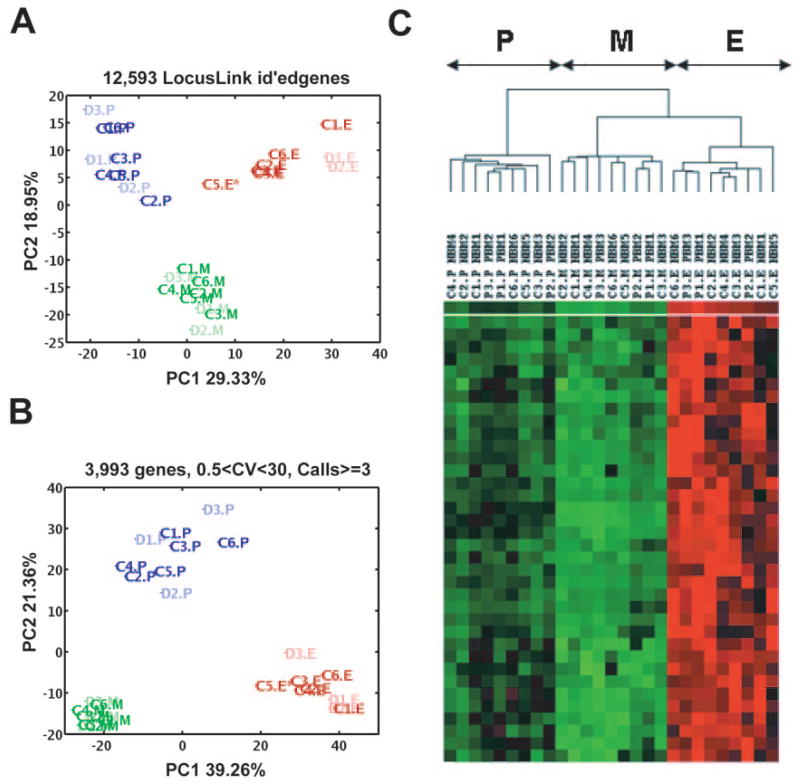
Figure 2.
Distinguishing three bone marrow populations by principal component analysis and hierarchical clustering. (A): PC1 and PC2 performed on 12,593 genes (with LocusLink identification) and 27 samples clearly distinguished three cell populations, P, E, and M. Blue, P population (dark blue, control samples [C1–C6]; light blue, diseased samples [D1–D3]); red, E population (dark red, control samples; light red, diseased samples); green, M population (dark green, control samples; light green, diseased samples). (B): PC1 and PC2 performed on 3,993 genes also separate three cell populations (P, E, and M) and show the P population to be the most genomically heterogenous of the three; the areas of P:E:M are 13:7:1. (C): Hierarchical clustering identifies three major clusters, with different expression patterns perfectly overlapped with three bone marrow progenitors (P, E, and M). Erythroid and myeloid populations form related but distinct subsets, whereas the more primitive P population is more distant. Abbreviations: C, control sample; CV, coefficient of variance; D, diseased sample; E, erythroid; id, identification; M, myeloid; P, multipotential; PC, principal component.

