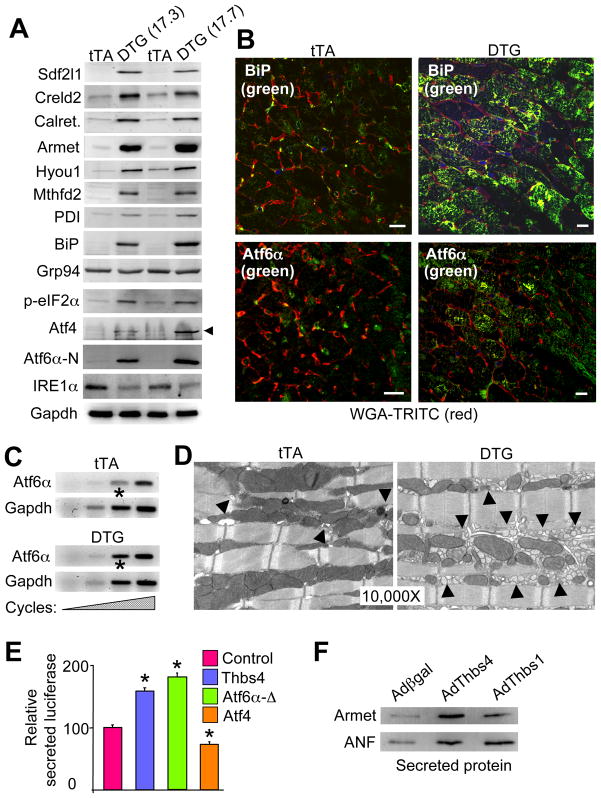
Figure 2.
Unique ER stress induction profile associated with Thbs4 expression. (A) Western blots for expression of ER stress response proteins from the hearts of two lines of Thbs4 DTG mice versus tTA control hearts. (B) Immunohistochemistry for Atf6α and BiP (green) in heart sections from tTA controls or Thbs4 DTG mice. Membranes of the cardiomyocytes are shown in (scale bars = 10 μm). (C) Increasing RT-PCR cycles for Atf6α mRNA in hearts of tTA control or Thbs4 DTG mice. Gapdh mRNA was used as a loading/normalization control. The asterisk shows increased Aft6α mRNA in the DTG hearts at the most linear cycle number in the RT-PCR reaction. (D) Transmission electron microscopy (EM) of heart sections from tTA control and Thbs4 DTG mice shows ER/SR and vesicles (arrowheads) in control and Thbs4 DTG hearts. (E) Luciferase activity in the media of NIH 3T3 cells transfected with a plasmid encoding a secreted version of luciferase that was co-transfected with Thbs4, Atf6α-Δ (constitutively nuclear) or Atf4 (all internally normalized to co-transfected β-gal plasmid). *P<0.05 versus the luciferase plasmid only. (F) Western blotting for the ER processed and secreted proteins Armet and ANF from concentrated media of neonatal rat cardiomyocytes previously infected with adenoviruses encoding β-galactosidase (control), Thbs4 or Thbs1. Also see Figure S3 and S4.

