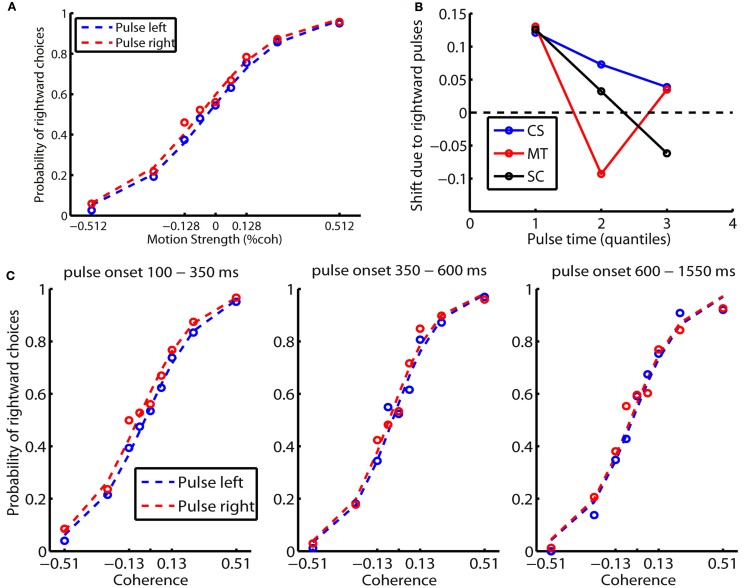
Figure 6.
Results of experiment 1A with pulse perturbations. (A) The pulse results in a shift in the observer’s psychometric function. As an example, the result of CS is shown here. The percentage of rightward choices is plotted against rightward coherence levels. The red curve denotes rightward pulse and the blue curve denotes leftward pulse. (B,C) The effect size of the shift varies with the time of the pulse. (C) The psychometric function of participant CS as the pulse comes early, intermediate and late in the trial. (B) The effect size of the pulse in the unit of the equivalent motion coherence as a function of pulse time for all of the three observers.

