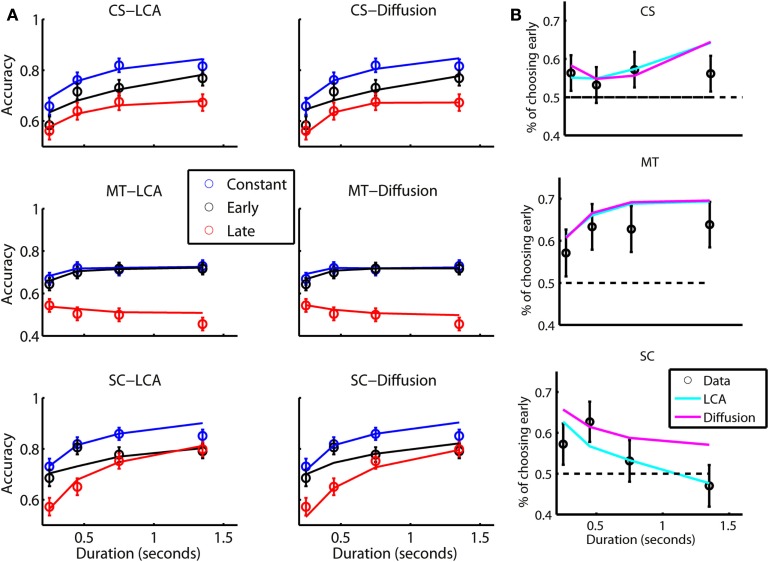
Figure 7.
Results of experiment 1B. (A) Accuracy as a function of stimulus duration in the constant, early and late conditions. Left: Data (symbols) and the leaky competing accumulator fit (lines). Error bars correspond to 95% CI. Right: Data and bounded diffusion fit. (B) Predictions of the leaky competing accumulator (cyan) and bounded diffusion (magenta) in the switch condition. Parameters of the models are from the fitting in Panel A. Proportion of choices supported early in the trial was plotted against stimulus duration. Error bars correspond to 95% CI. Larger error bars are due to smaller sample size in the switch condition.

