
Figure 3.
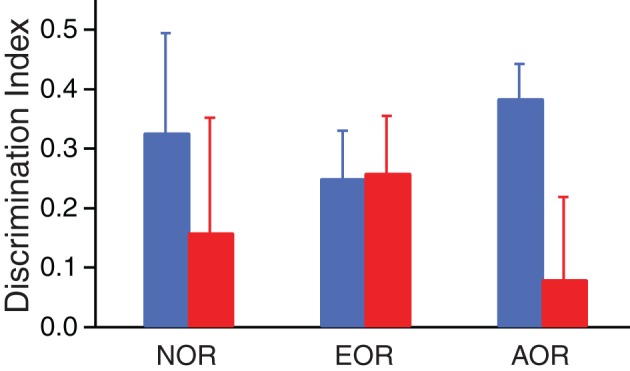
Differential exploration of novel vs. familiar items in the three tasks. The bar graph illustrates the discrimination index of Resilient (blue) and PTSD-like (red) rats in the three tasks (NOR, left; EOR, middle; AOR, right). To compute the discrimination indices, we used exploration times during the first 1.5 min of the test phase.